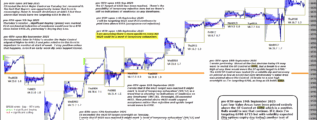
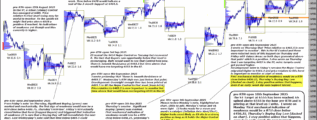
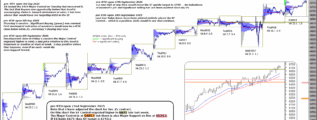
Pre-RTH Open today, ES has tested above 6075, if we see clear rejection early in the session then downside would be 6024. Price printing time above 6075 would be the first positive at the start of the week. … [Continue reading]
Daily analysis - Stock Market, Bonds, Forex and more
Posted on Written by Chart Prophet
Pre-RTH Open today, ES has tested above 6075, if we see clear rejection early in the session then downside would be 6024. Price printing time above 6075 would be the first positive at the start of the week. … [Continue reading]
Posted on Written by Chart Prophet
After Wednesday's snap-back, Significant Sellers re-entered on Thursday, generating a lower Value Area. Sellers have been active this week (red) but so far ineffective on the longer time-frame. This could be 'Buyers Resting'. Unless Sellers make an … [Continue reading]
Posted on Written by Chart Prophet
Sellers appeared to take Control of the day-frame early in the week, see Tue's note - but following inflation data on Wednesday, ES snapped back to test the minor Control at 6095, see note 12/06. As I've written this week - a Value Area generated … [Continue reading]
Posted on Written by Chart Prophet
In yesterday's note I wrote that "Price relative to 6095 is worth monitoring at the start of the week". ES opened on Monday just above that level but immediately rejected it, declining sharply. Later in the day Significant Selling (red) was marked. … [Continue reading]
Posted on Written by Chart Prophet
ES is finding 6095 attractive, this is now the 1mn Control, see Friday's note. Price relative to 6095 is worth monitoring at the start of this week and a Value Area generated above that level would be a further positive. First Support remains at … [Continue reading]
Posted on Written by Chart Prophet
The minor (15day) Control has moved to 6095. Price relative to that level is worth monitoring today. First mechanical sign of weakness is a RTH close below 6072.5, Wednesday's Buying Day Low. … [Continue reading]
Posted on Written by Chart Prophet
Significant Buying (green) marked again on Wednesday as ES sets another high. Buyers are Active and Effective, see note 11/25. First mechanical sign of weakness is a RTH close below 6072.5, yesterday's Buying Day Low. … [Continue reading]
Posted on Written by Chart Prophet
Positive price action since 11/21, see highlighted notes on chart. ES breaking higher. … [Continue reading]
Posted on Written by Chart Prophet
First Support at 6022. Monday's Value Area was generated entirely above that level which is a positive. Mechanically, the first sign of weakness would be a RTH close below 6049.75, yesterday's Buying Day (green) Low. … [Continue reading]
Posted on Written by Chart Prophet
Positive price action since 11/21 see highlighted notes on chart. First Support moved higher to 6006, see note 11/27, ES then found Support at that level. First Support then moved higher again to 6022 which was tested and rejected on Friday, see … [Continue reading]