• Home

chartprofit.com

Daily analysis - Stock Market, Bonds, Forex and more

emini SP500 6th Nov 2020

Posted on November 6, 2020 Written by Chart Prophet

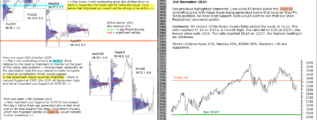
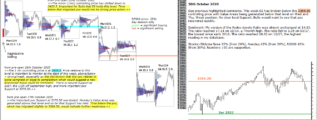
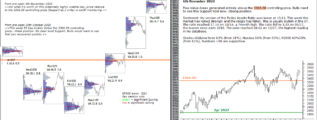
Two Value Areas generated entirely above the 3366.50 controlling price. Bulls need to see this Support hold now. Strong position. Sentiment: My version of the Rydex Assets Ratio was lower at 13.61. This week the market has rallied strongly and the … [Continue reading]

Filed Under: emini SP500 (ES)

emini SP500 5th Nov 2020

Posted on November 5, 2020 Written by Chart Prophet

Wednesday's Value Area was generated entirely above the 3366.50 controlling price, see yesterday's comments. Bulls would want to see this level (now Support) hold. Sentiment: My version of the Rydex Assets Ratio was slightly higher at 14.36 and … [Continue reading]

Filed Under: emini SP500 (ES)

emini SP500 4th November 2020

Posted on November 4, 2020 Written by Chart Prophet

For what it's worth on this potentially highly volatile day, price relative to the 3366.50 controlling price (Support as I write) is worth monitoring.is worth monitoring. Sentiment: My version of the Rydex Assets Ratio was lower at 13.97. The … [Continue reading]

Filed Under: emini SP500 (ES)

emini SP500 3rd November 2020

Posted on November 3, 2020 Written by Chart Prophet

Last week ES broke below the 3366.50 controlling price and four Value Areas have now been generated below that level. Weak position but some minor Support has emerged; at 3271 (10day). ES found Support there at the day-session low on Monday. Useful … [Continue reading]

Filed Under: emini SP500 (ES)

emini 2nd November 2020

Posted on November 2, 2020 Written by Chart Prophet

See previous highlighted comments on chart. Last week ES broke below the 3366.50 controlling price with Value Areas being generated below that level on Wed-Fri. Weak position. No clear local Support. Bulls would want to see that poc (now Resistance) … [Continue reading]

Filed Under: emini SP500 (ES)

ChartProfit Chart Book 30th October 2020

Posted on November 1, 2020 Written by Chart Prophet

ChartProfit Chart Book - week ending 30th October 2020 … [Continue reading]

Filed Under: emini SP500 (ES)

emini SP500 30th Oct 2020

Posted on October 30, 2020 Written by Chart Prophet

See previous highlighted comments. This week ES has broken below the 3366.50 controlling price with Value Areas being generated below that level on Wed and Thu. Weak position. No clear local Support. Bulls would want to see that poc recovered … [Continue reading]

Filed Under: emini SP500 (ES)

emini weak position

Posted on October 29, 2020 Written by Chart Prophet

See previous highlighted comments on chart. ES broke below the 3366.50 controlling price and declined sharply with Wednesday's Value Area being generated entirely below that level. Weak position. No clear local Support. Sentiment: My version of … [Continue reading]

Filed Under: emini SP500 (ES)

emini SP500 28th Oct 2020

Posted on October 28, 2020 Written by Chart Prophet

See previous highlighted comments on chart. Overnight ES has broken below the 3366.50 controlling price and declined sharply, below 3320. Sentiment: My version of the Rydex Assets Ratio was slightly lower at 15.83. The ratio reached 17.14 on … [Continue reading]

Filed Under: emini SP500 (ES)

emini SP500 27th Oct 2020

Posted on October 27, 2020 Written by Chart Prophet

I wrote pre-open yesterday that price relative to 3435.5 (the 1 mn controlling price) was important to monitor, see highlighted comments on chart. The entire session was spent below that level in a weak position and the important poc Support at … [Continue reading]

Filed Under: emini SP500 (ES)

  • « Previous Page
  • 1
  • …
  • 118
  • 119
  • 120
  • 121
  • 122
  • …
  • 556
  • Next Page »

Archives

Copyright © 2026 · Focus Pro Theme on Genesis Framework · WordPress · Log in