• Home

chartprofit.com

Daily analysis - Stock Market, Bonds, Forex and more

ES emini 15th Oct 2020

Posted on October 15, 2020 Written by Chart Prophet

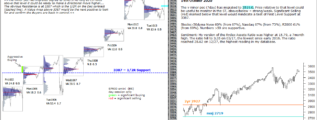
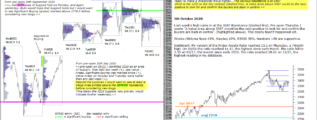
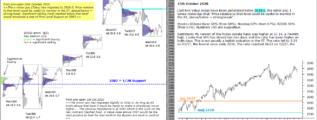
Last two Value Areas have been generated below 3519.0, the minor poc. I wrote yesterday that "Price relative to that level could be useful to monitor in the ST, above/below = strong/weak". Stocks>50dyma Nyse 58% (from 60%), Nasdaq 62% (from … [Continue reading]

Filed Under: emini SP500 (ES)

emini ES 14th Oct 2020

Posted on October 14, 2020 Written by Chart Prophet

The v minor poc (7day) has migrated to 3519.0. Price relative to that level could be useful to monitor in the ST, above/below = strong/weak. Significant Selling (red) marked below that level would mindicate a test of First Level Support at … [Continue reading]

Filed Under: emini SP500 (ES)

emini SP500 13th Oct 2020

Posted on October 13, 2020 Written by Chart Prophet

The last five Value Areas have been generated above the 3387 Resistance, dashed line, see highlighted comments from 10/01. Buyers back in control from 10/07. First Level Support is 2287, (1/2R). Stocks>50dyma Nyse 67% (from 64%), Nasdaq 73% … [Continue reading]

Filed Under: emini SP500 (ES)

emini ES 12th Oct 20

Posted on October 12, 2020 Written by Chart Prophet

The last four Value Areas have been generated above the 3387 Resistance, dashed line, see highlighted comments from 10/01. Buyers back in control from 10/07. First Level Support is 2287, (1/2R). Stocks>50dyma Nyse 64% , Nasdaq 70%, R2000 65%. … [Continue reading]

Filed Under: emini SP500 (ES)

ChartProfit Chart Book 9th Oct 2020

Posted on October 11, 2020 Written by Chart Prophet

ChartProfit Chart Book - week ending 9th October 2020 … [Continue reading]

Filed Under: emini SP500 (ES)

emini SP500 9th Oct 2020

Posted on October 9, 2020 Written by Chart Prophet

The last three Value Areas have been generated above the 3387 Resistance (dashed line) and, as I wrote a week ago, a VA above that level would be confirmation that Buyers are back in control, see highlighted comments. Bulls would want to see that … [Continue reading]

Filed Under: emini SP500 (ES)

emini SP500 8th Oct 2020

Posted on October 8, 2020 Written by Chart Prophet

Wednesday's Value Area was printed above the 3387 Resistance (dashed line) which, as I wrote a week ago, would be confirmation that Buyers are back in control, see previous, highlighted comments. Bulls would want to see that Support hold, but … [Continue reading]

Filed Under: emini SP500 (ES)

emini SP500 7th Oct 2020

Posted on October 7, 2020 Written by Chart Prophet

Most of Tuesday's session was spent above the 3387 Resistance (dashed line). Unfortunately, late in the day there was a sharp sell-off on news and ES closed below the 3370.50 poc, which is a weaker position. The session close was also below the low … [Continue reading]

Filed Under: emini SP500 (ES)

emini SP500 6th Oct 2020

Posted on October 6, 2020 Written by Chart Prophet

Last week's high came in at the 3387 Resistance (dashed line) but that has now been exceeded. Monday's Value Area was generated above the 3370.5 poc and Aggressive Buying was marked. These are all positives. A Value Area above 3387 would be the next … [Continue reading]

Filed Under: emini SP500 (ES)

emini SP500 5th Oct 2020

Posted on October 5, 2020 Written by Chart Prophet

Last week's high came in at the 3387 Resistance (dashed line). Pre-open Thursday I wrote "A Value Area above 3387 would be the next positive to look for and confirm the Buyers are back in control", (highlighted above). This clearly hasn't happened … [Continue reading]

Filed Under: emini SP500 (ES)

  • « Previous Page
  • 1
  • …
  • 120
  • 121
  • 122
  • 123
  • 124
  • …
  • 556
  • Next Page »

Archives

Copyright © 2026 · Focus Pro Theme on Genesis Framework · WordPress · Log in