• Home

chartprofit.com

Daily analysis - Stock Market, Bonds, Forex and more

emini SP500 10th September 2020

Posted on September 10, 2020 Written by Chart Prophet

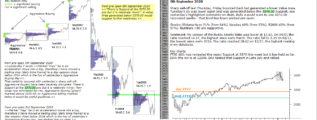
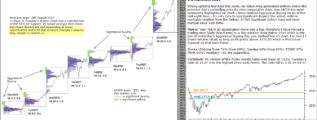
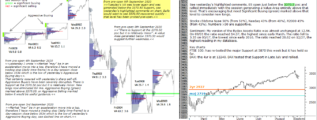
See yesterday's comments highlighted on chart. ES opened the session just below the 3370.5 poc and rallied immediately generating a Value Area entirely above that level. That's encouraging but need Significant Buying (green) marked above that level … [Continue reading]

Filed Under: emini SP500 (ES)

emini SP500 9th September 2020

Posted on September 9, 2020 Written by Chart Prophet

Sharp sell-off last Thursday. Friday bounced back but generated a lower Value Area. Tuesday's VA was lower again and was generated below the 3370.50 Support, see yesterday's highlighted comments on chart. Bulls would want to see 3370.50 recovered … [Continue reading]

Filed Under: emini SP500 (ES)

emini 8th September 2020

Posted on September 8, 2020 Written by Chart Prophet

Sharp sell-off on Thursday and Friday generated a lower Value Area. As I wrote pre-open Friday "There is Support at the 3370.50 poc but it is relatively minor". That Support was briefly tested but Friday's VA was almost entirely above that level. A … [Continue reading]

Filed Under: emini SP500 (ES)

ChartProfit Chart Book 4th September 2020

Posted on September 6, 2020 Written by Chart Prophet

ChartProfit Chart Book - week ending 4th September 2020 … [Continue reading]

Filed Under: emini SP500 (ES)

emini SP500 4th September 2020

Posted on September 4, 2020 Written by Chart Prophet

See yesterday's pre-open comments, highlighted on chart. I wrote >>Market "may" be in an acceleration move into a top, therefore I have moved a trading stop (daily time-frame) to a day-session close below 3534 which is the low of yesterday's … [Continue reading]

Filed Under: emini SP500 (ES)

Pulse Chart Update

Posted on September 3, 2020 Written by Chart Prophet

In the pre-open report today I wrote that a trading stop (daily time-frame) was now in place which is a day-session close below 3534, the low of yesterday's Aggressive Buying day. See Green bars on Pulse Chart below which represent Aggressive Buying … [Continue reading]

Filed Under: emini SP500 (ES)

emini S&P 500 3rd September 2020

Posted on September 3, 2020 Written by Chart Prophet

Strong uptrend has held this week. No Value Area generated entirely below the previous day's controlling price for nine consecutive days. See 08/19 pre-open comments, highlighted on chart. I have marked Aggressive Buying on six of the last eight days … [Continue reading]

Filed Under: emini SP500 (ES)

emini SP500 2nd September 2020

Posted on September 2, 2020 Written by Chart Prophet

Strong uptrend held on Tuesday. No Value Area generated below the previous day's for eight consecutive days. See 08/19 pre-open comments, highlighted on chart. 3370.50 is First Level Support of importance. Key chartsFTSE 100: recent multiple … [Continue reading]

Filed Under: emini SP500 (ES)

emini SP500 1st September 2020

Posted on September 1, 2020 Written by Chart Prophet

Strong trend up for seven days with no Value Area generated below the previous day's. See 08/19 pre-open comments, highlighted on chart. 3370.50 is First Level Support of importance. Key chartsFTSE 100: recent multiple rejections in June/July at … [Continue reading]

Filed Under: emini SP500 (ES)

emini ES 31st August 2020

Posted on August 31, 2020 Written by Chart Prophet

Strong trend up last week with Value Areas generated above the previous day's poc, monday through Thursday. Thursday's low tested Wednesday's poc and rallied immediately. See 08/19 pre-open comments, highlighted on chart. 3370.50 is First Level … [Continue reading]

Filed Under: emini SP500 (ES)

  • « Previous Page
  • 1
  • …
  • 123
  • 124
  • 125
  • 126
  • 127
  • …
  • 556
  • Next Page »

Archives

Copyright © 2026 · Focus Pro Theme on Genesis Framework · WordPress · Log in