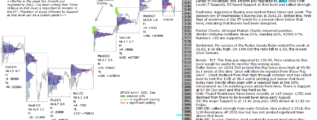
• Home

chartprofit.com

Daily analysis - Stock Market, Bonds, Forex and more

emini SP500 4th June 2020

Posted on June 4, 2020 Written by Chart Prophet

emini 4th June 2020 - pre-open from ChartProfit First sign of weakness would be a day session close below 3047.50, Tuesday's low (dashed line) see highlighted comments. First Level Support is at 2926.0, the 2yr poc. The most important Support is … [Continue reading]

Filed Under: emini SP500 (ES)

emini SP500 being aggressively bought

Posted on June 3, 2020 Written by Chart Prophet

Dayframe: Aggressive Buying was marked. First sign of weakness would be a day session close below 3047.50, Tuesday's low. First Level Support is now at 2926.0, the 2yr poc. The most important Support is at 2719, the maj poc. ES needs to hold this … [Continue reading]

Filed Under: emini SP500 (ES)

emini SP500 at its highest level since 3rd March

Posted on June 2, 2020 Written by Chart Prophet

The emini SP500 futures printed its highest level since 3rd March. The emini SP500 futures printed its highest level since 3rd March. On 05/14, There was a brief, rejected test of First Level Support at 2786, the 1/2R off this year's high (dashed … [Continue reading]

Filed Under: emini SP500 (ES)

emini SP500 holding higher levels at the start of this week

Posted on June 1, 2020 Written by Chart Prophet

emini SP500 holding higher levels at the start of this week. On 05/14, There was a brief, rejected test of First Level Support at 2786, the 1/2R off this year's high (dashed line on chart) and ES moved strongly higher from there. First Level Support … [Continue reading]

Filed Under: emini SP500 (ES)

Nikkei broke chart resistance this week

Posted on May 31, 2020 Written by Chart Prophet

This week Nikkei exceeded the major chart resistance at 21384 and is in a strong position if it can hold that level, now support. … [Continue reading]

Filed Under: emini SP500 (ES)

DAX has broken above chart resistance

Posted on May 31, 2020 Written by Chart Prophet

DAX has exceeded the 1/2R Resistance at 11045. Next Resistance is 12240, the 4yr. … [Continue reading]

Filed Under: emini SP500 (ES)

FTSE chart support at 5870

Posted on May 31, 2020 Written by Chart Prophet

Back at the start of April I wrote that "the important Resistance on the FTSE chart is at 5870. Price above that level would be a stronger position." FTSE is currently printing above that level in a stronger position. … [Continue reading]

Filed Under: emini SP500 (ES)

SPY chart support now at 292-76

Posted on May 31, 2020 Written by Chart Prophet

SPY found Support twice at 272.72 (major) and Resistance twice at 292.76, (18mn). That Resistance has now been exceeded and becomes Support. … [Continue reading]

Filed Under: emini SP500 (ES)

IWM has moved to a stronger position

Posted on May 31, 2020 Written by Chart Prophet

at a second attempt, IWM has moved to a stronger position above 134.60, the 1/2R Resistance which is now Support. … [Continue reading]

Filed Under: emini SP500 (ES)

ChartProfit Chart Book 29th May 2020

Posted on May 30, 2020 Written by Chart Prophet

ChartProfit Chart Book - week ending 29th May 2020 … [Continue reading]

Filed Under: Stock Market sentiment

  • « Previous Page
  • 1
  • …
  • 131
  • 132
  • 133
  • 134
  • 135
  • …
  • 556
  • Next Page »

Archives

Copyright © 2026 · Focus Pro Theme on Genesis Framework · WordPress · Log in