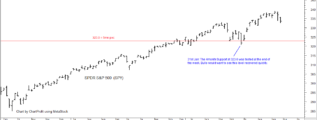
from 31st Jan: "The 4month Support at 323.0 was tested at the end of the week. Bulls would want to see this level recovered quickly." That level was recovered quickly and SPY rallied. 323 is First Level Support. Chart updated. … [Continue reading]
Daily analysis - Stock Market, Bonds, Forex and more
from 31st Jan: "The 4month Support at 323.0 was tested at the end of the week. Bulls would want to see this level recovered quickly." That level was recovered quickly and SPY rallied. 323 is First Level Support. Chart updated. … [Continue reading]
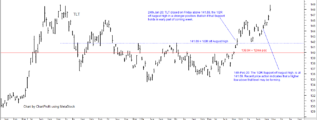
from 14th Feb 20: "The 1/2R Support off August high, is at 141.69. Recent price action indicates that a higher low above that level may be forming". Chart updated. … [Continue reading]
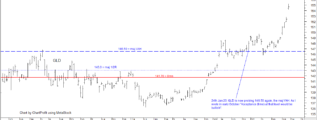
from 24th Jan 20: "GLD is now probing 146.50 again, the maj VAH. As I wrote in early October "Acceptance (time) at that level would be bullish". Chart Updated … [Continue reading]
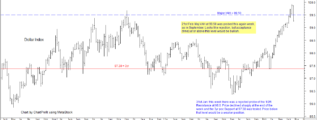
Dollar Index - The Major Value Area High at 99.50 was probed again this week, as in September. Looks like rejection, but acceptance (time) at or above this level would be bullish. … [Continue reading]
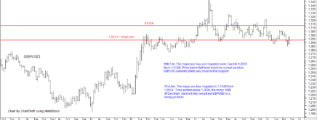
from 10th Feb: The major poc has just migrated lower, back to 1.2933 (from 1.3128). Price below that level would be a weak position. GBPUSD currently prints very close to that Support. … [Continue reading]
ChartProfit Chart Book - week ending 21st January 2020 … [Continue reading]
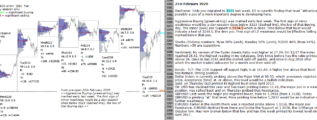
S&P 500 emini 21st February 2020 Dayframe: 14dy poc migrated to 3371 last week. ES is curently finding that level "attractive", possibly a poc of a more important degree is developing here. Aggressive Buying (green-at-top) was marked early … [Continue reading]
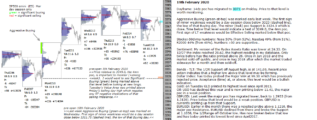
S&P 500 emini 19th February 2020 - pre-open Dayframe: 14dy poc has migrated to 3371 on Friday. Price to that level is worth monitoring. Aggressive Buying (green-at-top) was marked early last week. The first sign of minor weakness would be a … [Continue reading]
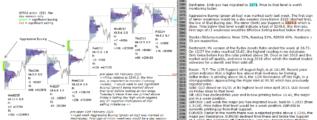
emini S&P 500 18th February 2020 - pre-open Dayframe: 14dy poc has migrated to 3371. Price to that level is worth monitoring today. Aggressive Buying (green-at-top) was marked early last week. The first sign of minor weakness would be a … [Continue reading]
ChartProfit Chart Book - week ending 14th January 2020 … [Continue reading]