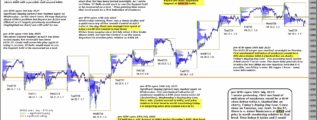
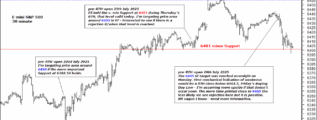
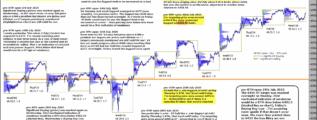
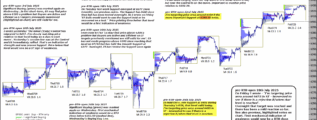
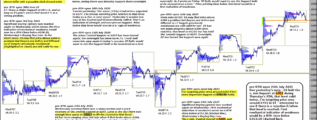
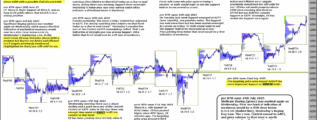
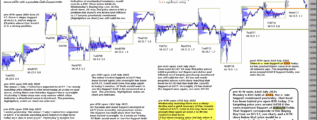
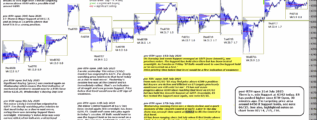
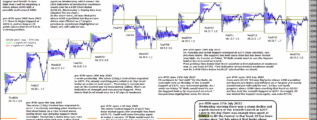
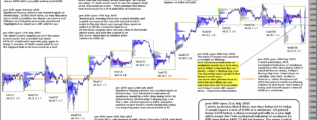
• Home

chartprofit.com

Daily analysis - Stock Market, Bonds, Forex and more

ES_F e-mini 14th October 2024

Posted on October 14, 2024 Written by Chart Prophet

ES is printing above 5830 which, I wrote on Friday, would lessen the chances of a reversal here. I wrote on 10/10, 'Trend/technicals obviously still indicate higher'. … [Continue reading]

Filed Under: emini SP500 (ES)

ES_F e-mini 11th October 2024

Posted on October 11, 2024 Written by Chart Prophet

I wrote yesterday - 'Trend/technicals obviously still indicate higher but a clear rejection of price above 5830 here would be interesting'. The longer ES prints close to or above 5830 the lesser the chances of a reversal here. I'm looking for a … [Continue reading]

Filed Under: emini SP500 (ES)

ES_F e-mini 10th September 2024

Posted on October 10, 2024 Written by Chart Prophet

I wrote 24th September 'Price above 5830 though and the trend might start to get exhausted'. That is being put to the test now with ES printing above 5840 in the minutes before RTH and then declining quickly. Trend/technicals obviously still indicate … [Continue reading]

Filed Under: emini SP500 (ES)

ES_F e-mini 8th October 2024

Posted on October 8, 2024 Written by Chart Prophet

The high on 09/26 (5 minutes before RTH) was 5830, see note 09/24. On 09/25 the 1month Control moved to 5771.50. ES is currently printing below that level (now Resistance) and aligning more with the negative scenario outlined in yesterday's note … [Continue reading]

Filed Under: emini SP500 (ES)

ES_F e-mini 7th October 2024

Posted on October 7, 2024 Written by Chart Prophet

ES rallied back above 5771.50 at the end of last week, see Friday's note on chart. Overnight that level (now Support) has been tested. Negative scenario at the start of this week would be a break back below that Support indicating further weakness, … [Continue reading]

Filed Under: emini SP500 (ES)

ES_F e-mini 4th October 2024

Posted on October 4, 2024 Written by Chart Prophet

Pre-open today ES is printing back above 5771.50 and as long as that level holds it is in a stronger position (see yesterday's note). A break back below would indicate further weakness. … [Continue reading]

Filed Under: emini SP500 (ES)

ES_F e-mini 3rd October 2024

Posted on October 3, 2024 Written by Chart Prophet

On Tuesday ES broke below 5771.50 First Support and on Wednesday this level became Resistance, see chart. Not great price action. As I wrote on 09/26 'Time below that level would be first sign of weakness.' Bulls would want to see 5771.50 recovered … [Continue reading]

Filed Under: emini SP500 (ES)

Relative Strength Index diverging on Weekly Charts

Posted on October 1, 2024 Written by Chart Prophet

Technical oscillators on the Weekly Charts, e.g. the popular Relative Strength Index (RSI), have been negatively diverging with price action over the past few weeks, see weekly SPY chart below. Personally, I think these 'indicators' are of … [Continue reading]

Filed Under: emini SP500 (ES)

ES_F e-mini 1st October 2024

Posted on October 1, 2024 Written by Chart Prophet

On Monday ES dipped briefly below First Support at 5771.50 but recovered quickly. For 8 days ES has been trading in a tight range, and generating narrow individual Value Areas, day to day. This often precedes a strong directional move that … [Continue reading]

Filed Under: emini SP500 (ES)

ES_F e-mini 30th September 2024

Posted on September 30, 2024 Written by Chart Prophet

First Support moved to 5771.50 on 09/25, see note 09/26. That has held so far. From note 09/24 'Price above 5830 though and the trend might start to get exhausted'. Effective Selling was last marked 09/03 - nothing since then. … [Continue reading]

Filed Under: emini SP500 (ES)

  • « Previous Page
  • 1
  • …
  • 13
  • 14
  • 15
  • 16
  • 17
  • …
  • 539
  • Next Page »

Archives

Copyright © 2025 · Focus Pro Theme on Genesis Framework · WordPress · Log in