• Home

chartprofit.com

Daily analysis - Stock Market, Bonds, Forex and more

emini 6th March 2019 – pre-open

Posted on March 6, 2019 Written by Chart Prophet

emini futures

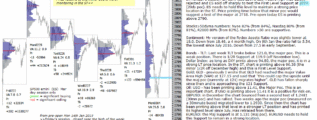
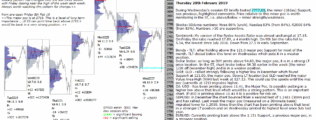
emini 6th March 2019 - pre-open from Chartprofit The 3month poc migrated to 2790. Price relative to this level is now important to monitor re ST strength/weakness. Pre-open today ES is printing below 2790. Stocks>50dyma numbers: Nyse 80% (from … [Continue reading]

Filed Under: emini SP500 (ES)

emini futures 5th March 2019 – pre-open

Posted on March 5, 2019 Written by Chart Prophet

emini SP500

emini futures 5th March 2019 - pre-open from Chartprofit In Monday's session an early test above last week's high was quickly rejected and ES sold off sharply to test the First Level Support at 2777 (20dy poc). ES needs to hold this level to … [Continue reading]

Filed Under: emini SP500 (ES)

emini 4th March 2019 – pre-open

Posted on March 4, 2019 Written by Chart Prophet

emini futures

emini 4th March 2019 - pre-open from Chartprofit Last week ES generated all Values Areas above 2777.00, the minor (20dy) poc, and on Wednesday there was a brief, rejected test of this Support, see chart. As long as ES holds this level it is in a … [Continue reading]

Filed Under: emini SP500 (ES)

TLT is in a weak position

Posted on March 2, 2019 Written by Chart Prophet

TLT chart

This week TLT broke below 121.0, the major poc. This is a weak position. There is 1/2R Support at 119.9 (off November low). … [Continue reading]

Filed Under: TLT

IWM reaches Major VAH

Posted on March 2, 2019 Written by Chart Prophet

IWM chart

IWM has reached 158, the Value Area High. Price will often be rejected at a major VAH. This hasn't happened yet. Acceptance (time) at this level would be a bullish indication. In any case, as long as SPY holds above 153.50 it is in a strong location. … [Continue reading]

Filed Under: IWM

Spyder reaches Value Area High

Posted on March 2, 2019 Written by Chart Prophet

SP500 chart

SPY has reached the 18mn Value Area High at 281. Price will often be rejected at a major VAH. This hasn't happened yet. Acceptance (time) at this level would be a bullish indication. In any case, as long as SPY holds above 272.49 it is in a strong … [Continue reading]

Filed Under: SP500

FTSE 100 chart 1st March 2019

Posted on March 2, 2019 Written by Chart Prophet

FTSE100 chart

The 18mn controlling price at 7037 is First Level Support. Price printing time below this level would suggest a re-test of the Major at 6820. … [Continue reading]

Filed Under: emini SP500 (ES)

Stockmarket Sentiment – charts through 1st March 2019

Posted on March 2, 2019 Written by Chart Prophet

Stock market Sentiment - Charts through 1st March 2019 - Chartprofit eBook Stock Market Sentiment. Consensus polls, mutual fund flow indicators, Commitment of traders charts. eBook PDF … [Continue reading]

Filed Under: Stock Market sentiment

emini 1st March 2019 – pre-open

Posted on March 1, 2019 Written by Chart Prophet

emini futures

emini 1st March 2019 - pre-open from Chartprofit During Wednesday’s session ES very briefly tested 2777.00, the minor (18day) Support, see previous, highlighted comments. Has rallid from there. Pre-open today ES is printing above … [Continue reading]

Filed Under: emini SP500 (ES)

emini 28th February 2019 – pre-open

Posted on February 28, 2019 Written by Chart Prophet

emini

emini 28th February 2019 - pre-open from Chartprofit During Wednesday's session ES briefly tested 2777.00, the minor (18day) Support, see previous, highlighted comments. Price relative to this minor poc is worth monitoring in the ST, i.e. … [Continue reading]

Filed Under: emini SP500 (ES)

  • « Previous Page
  • 1
  • …
  • 173
  • 174
  • 175
  • 176
  • 177
  • …
  • 556
  • Next Page »

Archives

Copyright © 2026 · Focus Pro Theme on Genesis Framework · WordPress · Log in