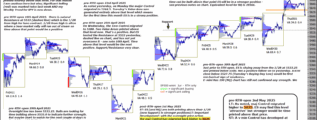
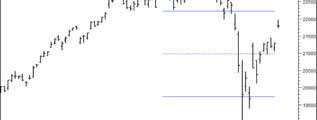
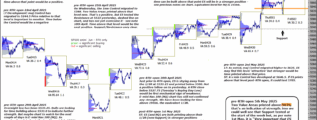
New high reached. Mechanically, a RTH close below 5286.75 (Wednesday's Buying Day Low) would be first sign of weakness but First Support is at 5244, the ST Control. … [Continue reading]
Daily analysis - Stock Market, Bonds, Forex and more
Posted on Written by Chart Prophet
New high reached. Mechanically, a RTH close below 5286.75 (Wednesday's Buying Day Low) would be first sign of weakness but First Support is at 5244, the ST Control. … [Continue reading]
Posted on Written by Chart Prophet
There has been a series of positive ST indications starting on 3rd May, see previous comments highlighted on chart, and on Friday, a postive indication on the Weekly time-frame. ST Control has migrated higher to 5244 and that is First Support - as … [Continue reading]
Posted on Written by Chart Prophet
Last week was a positive one - time was spent at/above the 3mn VAH, see note 05/07 and ES closed Friday above 5227, see note 05/10, indicating higher on the weekly time-frame. First Support at 5211.50 (minor Control). There could be Resistance around … [Continue reading]
Posted on Written by Chart Prophet
ES started showing positive indications on 2nd May, see previous highlighted notes on chart. That has continued through this week. The minor Control has migrated higher to 5231.5 and that is now First Level Support. There could be some Resistance … [Continue reading]
Posted on Written by Chart Prophet
The 3mn VAH is at 5207. Time spent at or above this level would be a further positive, see notes 05/03, 05/06 on chart. Support is at 5150, the 1/2R Resistance, Bulls would want to see that level hold now. … [Continue reading]
Posted on Written by Chart Prophet
ES ended Friday close to the high for the week and above 5150, the 1/2R Resistance, now Support. Friday's Value Area was generated entirely above 5104, the major Control. These are all positives. … [Continue reading]
Posted on Written by Chart Prophet
This week ES failed at the 5150 Resistance (see note 04/24) and then tested the 1mn Value Area Low at 5044 (dashed grey line). Has bounced from there (a positive). Development: overnight the Control has migrated slightly higher to 5104.0 (a … [Continue reading]
Posted on Written by Chart Prophet
ES failed at the 5150 Resistance (see note 04/24) and subsequently declined below the 5099.50 Control. Weak position. Today ES has tested the 1mn Value Area Low at 5044 (dashed grey line). Time at or below this level would indicate more weakness imo. … [Continue reading]
Posted on Written by Chart Prophet
ES is finding the 5150 Resistance (see note 04/24) difficult to overcome. As mentioned I would want to see time printed above that level before looking long. … [Continue reading]
Posted on Written by Chart Prophet
as per Wednesday's note: It would be unusual to see a dip from high end on a week with Friday on the low (but not unknown) that's why I'd rather see if ES can recover above Resistance at 5150 (1/2R off high - dashed) before looking long. ES … [Continue reading]