• Home

chartprofit.com

Daily analysis - Stock Market, Bonds, Forex and more

ES_F e-mini futures 13th January 2025

Posted on January 13, 2025 Written by Chart Prophet

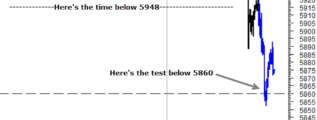
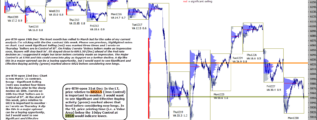
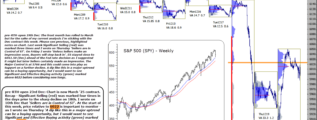
I wrote on 9th Jan that 'Time below 5948 could precede a test below 5860', see previous notes on chart. At the start of this week ES is in a weak position and as I wrote on Friday, I'm not considering new longs unless that level is recovered. … [Continue reading]

Filed Under: emini SP500 (ES)

e-mini SP500 development

Posted on January 10, 2025 Written by Chart Prophet

I wrote yesterday'ST Control moved slightly lower to 5948. Time below that level could precede a test below 5860'. Next?There's been development: The 3mn Control migrated lower to 5948 (from 6022.50). Bulls would want to see this level recovered … [Continue reading]

Filed Under: emini SP500 (ES)

ES_F e-mini futures 9th January 2025

Posted on January 9, 2025 Written by Chart Prophet

ST Control moved slightly lower to 5948. Time below that level could precede a test below 5860. Bulls would want to see 6022.50 exceeded. … [Continue reading]

Filed Under: emini SP500 (ES)

ES_F e-mini futures 8th January 2025

Posted on January 8, 2025 Written by Chart Prophet

On 3rd Jan I wrote 'I'm looking for Effective Buying (green) marked above 6022.5 (3mn Control) before considering new longs'. In Tuesday's session we saw the opposite, i.e. Effective Selling (red) marked below that level and currently ES is … [Continue reading]

Filed Under: emini SP500 (ES)

ES_F e-mini futures 7th January 2025

Posted on January 7, 2025 Written by Chart Prophet

ES is currently printing above the 6022.50 Control in a stronger position. There was a dip below that Support during yesterday's session and most time was spent printing close to it. A Value Area generated above 6022.50 would be more convincingly … [Continue reading]

Filed Under: emini SP500 (ES)

ES_F e mini futures 6th January 2025

Posted on January 6, 2025 Written by Chart Prophet

ES opened RTH above the 6022.50 Control which puts it back in a strong position. This increases the odds that a price distribution which began in early November has just completed. If that is the case, and the next distribution is up, 6022.50 will … [Continue reading]

Filed Under: emini SP500 (ES)

ES_F S&P 500 e-mini futures 3rd January 2025

Posted on January 3, 2025 Written by Chart Prophet

On Thursday, ES generated a second Value Area below 5954. From note 12/31 'a Value Area below the 10day Control at 5954 would indicate lower'. In the ST, this is a weakened position. There was a dip lower yesterday to 5875 but ES may want to test the … [Continue reading]

Filed Under: emini SP500 (ES)

ES_F S&P 500 e-mini future 2nd January 2025

Posted on January 2, 2025 Written by Chart Prophet

see note 12/31 on chart - looking for Effective Buying (green) marked above 6022.5 (3mn Control) before considering new longs. ST: On Tuesday ES generated a Value Area below 5954 (minor Control) but overnight has recovered - price back below that … [Continue reading]

Filed Under: emini SP500 (ES)

ES_F S&P 500 e-mini future 31st December 2024

Posted on December 31, 2024 Written by Chart Prophet

In the LT, price relative to 6022.5 (3mn Control) is important to monitor. I would want to see Significant and Effective Buying activity (green) marked above that level before considering new longs. In the ST, price printing time (i.e. a Value … [Continue reading]

Filed Under: emini SP500 (ES)

ES_F S&P 500 e-mini future 23rd December 2024

Posted on December 23, 2024 Written by Chart Prophet

Chart is now March '25 contract.Recap - Significant Selling (red) was marked four times in the days prior to the sharp decline on 18th. I wrote on 10th Dec that 'Sellers are in Control of ST'. At the start of this week, price relative to 6022 is … [Continue reading]

Filed Under: emini SP500 (ES)

  • « Previous Page
  • 1
  • …
  • 26
  • 27
  • 28
  • 29
  • 30
  • …
  • 556
  • Next Page »

Archives

Copyright © 2026 · Focus Pro Theme on Genesis Framework · WordPress · Log in