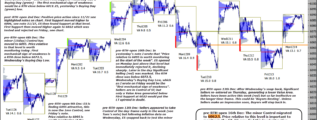
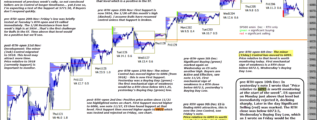
• Home

chartprofit.com

Daily analysis - Stock Market, Bonds, Forex and more

ES_F e-mini 2nd January 2024

Posted on January 2, 2024 Written by Chart Prophet

Nothing yet to weaken the LT bullish view. First sign of weakness in the ST would be time below 4778.0 (1mn Control). Below that, the minor VAL is at 4743 (dashed on chart). … [Continue reading]

Filed Under: emini SP500 (ES)

ES_F e-mini 21st December 2023

Posted on December 21, 2023 Written by Chart Prophet

First sign of weakness in the LT is a RTH close below 4650.5, the Buying Day Low on 12/13. Today, price relative to 4774.5 (v. min Control) is worth monitoring - above/strong. … [Continue reading]

Filed Under: emini SP500 (ES)

ES_F e-mini 20th December 2023

Posted on December 20, 2023 Written by Chart Prophet

Still seeing nothing to weaken the bullish view. No Significant Selling (red) marked since 10/27, and on that day there was a rejected test of the major Support at 4136. As I wrote on 10/26: The Major Control (months) is at 4136 and long-term Bulls … [Continue reading]

Filed Under: emini SP500 (ES)

ES_F e-mini 12th December 2023

Posted on December 12, 2023 Written by Chart Prophet

My post on 11/21 included a weekly chart with a major VAH level shown at 4527 - I wrote the following 'Rejection is common at a VAH but time (acceptance) at or around this level would be a further bullish indication'.In the longer time-frame there … [Continue reading]

Filed Under: emini SP500 (ES)

ES_F e-mini 11th December 2023

Posted on December 11, 2023 Written by Chart Prophet

The 4570 (min Control) was recovered quickly on Thursday, see Thursday's pre-RTH note. Both Thursday's and Friday's Value Areas were generated above that level. This recovery may see the break higher we have been looking for - unlike 12/01. Support … [Continue reading]

Filed Under: emini SP500 (ES)

ES_F e-mini 7th December 2023

Posted on December 7, 2023 Written by Chart Prophet

Wednesday's RTH closed below Friday's Buying Day Low which puts the ST bull case in doubt, see Monday's note. also from that note: time below 4524 (7mn Control) would be unexpected and weaken the Bullish scenario. Bulls would want to see 4570 … [Continue reading]

Filed Under: emini SP500 (ES)

ES_F e-mini 6th December 2023

Posted on December 6, 2023 Written by Chart Prophet

Technically, last week finished positively and although there has been a slight retracement at the start of this week with ES continuing to "like" 4570 (see previous notes) there has been no clear sign of weakness. … [Continue reading]

Filed Under: emini SP500 (ES)

ES_F e-mini 4th December 2023

Posted on December 4, 2023 Written by Chart Prophet

In Friday's note I wrote I was looking for a Value Area above 4570 to signal the next leg higher. That's what we saw on Friday, see chart. A RTH close below 4562.5 (Friday's Buying Day low) would put this in doubt and imo time below 4524 (7mn … [Continue reading]

Filed Under: emini SP500 (ES)

ES_F e-mini 30th November 2023

Posted on November 30, 2023 Written by Chart Prophet

price is consolidating around 4570 - I'm looking for a Value Area above that level to signal next leg higher or one below 4524 (7mn Control) as an indication of weakness. … [Continue reading]

Filed Under: emini SP500 (ES)

ES_F e-mini 29th November 2023

Posted on November 29, 2023 Written by Chart Prophet

Today, price has convincingly exceeded 4570. As mentioned previously, first sign of weakness would be time back below 4524, the 7mn Control. … [Continue reading]

Filed Under: emini SP500 (ES)

  • « Previous Page
  • 1
  • …
  • 27
  • 28
  • 29
  • 30
  • 31
  • …
  • 539
  • Next Page »

Archives

Copyright © 2025 · Focus Pro Theme on Genesis Framework · WordPress · Log in