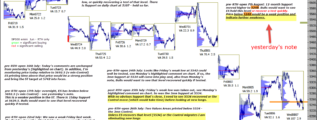
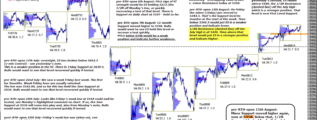
Value Areas have been higher or overlapping/higher for nine consecutive days with Significant Buying (green) marked four times in that period. As per yesterday's note, a RTH close below 5573.5 would be first sign of weakness. … [Continue reading]
Daily analysis - Stock Market, Bonds, Forex and more
Value Areas have been higher or overlapping/higher for nine consecutive days with Significant Buying (green) marked four times in that period. As per yesterday's note, a RTH close below 5573.5 would be first sign of weakness. … [Continue reading]

Significant Buying activity (green) was marked again on Monday. The session low was 5573.5; a RTH close below 5573.5 would be a mechanical indication of weakness and put the 5790 target in doubt, see yesterday's note. … [Continue reading]
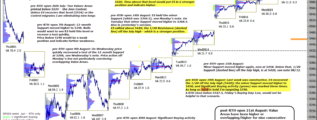
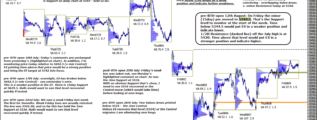
Last week was constructive. ES recovered the 1/2R off the July high (5420); the minor Support moved higher to 5458; and Significant Buying activity (green) was marked three times. As long as 5458 is held I'm targeting 5790. A RTH close below … [Continue reading]
Critical that ES holds the 1/2R Support (dashed line on chart) at 5420 - as long as it does I'm targeting 5800. … [Continue reading]
Minor Support moved higher again, now at 5458. Below that, 1/2R Support (dashed line) off the July high, is at 5420, see note 08/12. … [Continue reading]

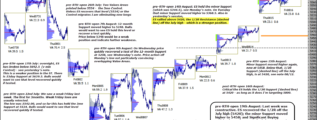
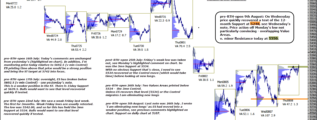
ES held the minor Support (which was 5344.5), see Monday's note. On Tuesday that minor Support moved higher to 5368.5. Also in yesterday's session, ES rallied above 5420, the 1/2R Resistance (dashed line) off the July high - which is a stronger … [Continue reading]
On Friday the minor (15day) poc moved to 5344.5. That's the Support level to monitor at the start of the week. Time below 5344.5 would put ES in a weaker position and indicate lower. 1/2R Resistance (dashed line on chart) off the July high is at … [Continue reading]
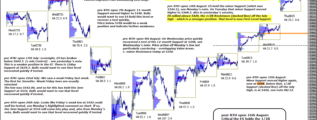
On Wednesday price quickly recovered a test of the 12-month Support at 5248, see Wednesday's note. Price action off Monday's low not particularly convincing - overlapping Value Areas. v. minor Resistance today at 5350. … [Continue reading]
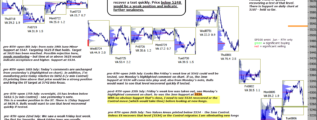
12-month Support moved higher to 5248. Bulls would want to see ES hold this level or recover a test quickly. Price below 5248 would be a weak position and indicate further weakness. … [Continue reading]