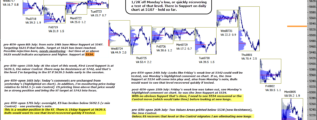
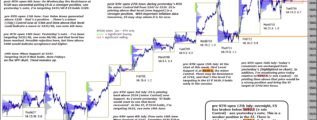
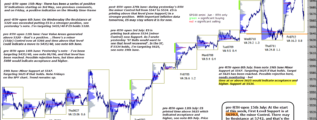
First sign of ST strength would be ES holding 5213 (the 1/2R off Monday's low, or quickly recovering a test of that level. There is Support on daily chart at 5107 - held so far. … [Continue reading]
Daily analysis - Stock Market, Bonds, Forex and more
First sign of ST strength would be ES holding 5213 (the 1/2R off Monday's low, or quickly recovering a test of that level. There is Support on daily chart at 5107 - held so far. … [Continue reading]
Last note was 26th July. I wrote 'I am eliminating new longs' as ES had moved into a weaker position, see previous comments highlighted on chart. Support on daily chart at 5107. … [Continue reading]
Two Values Areas printed below 5534 (now Resistance), the 3mn Control. Unless ES recovers that level or the Control migrates I am eliminating new longs, see yesterday's note. … [Continue reading]
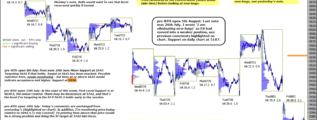
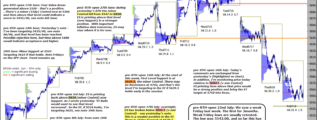
Friday's weak low was taken out, see Monday's note. So was the 3mn Support at 5534. With no obvious Support that's close, I need to see 5534 recovered or the Control move (which would take time) before looking at new longs. … [Continue reading]
Looks like Friday's weak low at 5542 could well be tested, see Monday's highlighted comment on chart. If so, the 3mn Support at 5534 will come into play and, also from Monday's note, Bulls would want to see that level recovered quickly if tested. … [Continue reading]
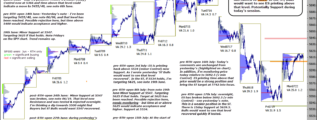
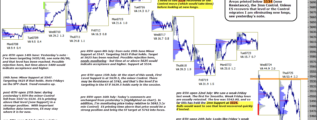
See yesterday's note. Still relevant. Overnight the minor (7day) Control has moved to 5603. In the ST, Bulls would want to see ES printing above that level. Potentially Support during today's session. … [Continue reading]
We saw a weak Friday last week. The first for 3 months. Weak Friday lows are usually retested. The low was 5542.00, and so far this decline has held the 3mn Support at 5534. Bulls would want to see that level recovered quickly if tested. There is … [Continue reading]
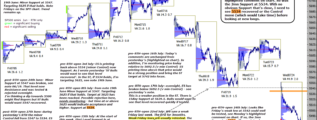
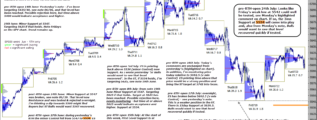
Overnight, ES has broken below 5692.5 (v min Control) - see yesterday's note. This is a weaker position in the ST. There is 15day Support at 5640. Bulls would want to see that level recovered quickly if tested. … [Continue reading]
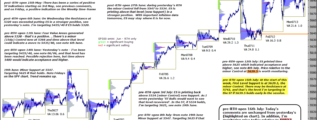
Today's comments are unchanged from yesterday's (highlighted on chart). In addition, I'm monitoring price today relative to 5692.5 (v min Control) - ES printing time above that price would be a strong position and bring the ST target at 5742 into … [Continue reading]
At the start of this week, First Level Support is at 5639.5, the minor Control. There may be Resistance at 5742, and that's the level I'm targeting in the ST if 5639.5 holds early in the session. In the longer term, Daily trend remains up, see … [Continue reading]