This week's Chartprofit eBook is available to view The DNL Reader is required to view the eBook. If you do not have this program please download it here: www.digitalwebbooks.com/reader/ *********** PRICE PERFORMANCE / LOCATION ES … [Continue reading]
Chartprofit webcast 29th August 2014
Chartprofit webcast Today's Chartprofit webcast is available to view … [Continue reading]
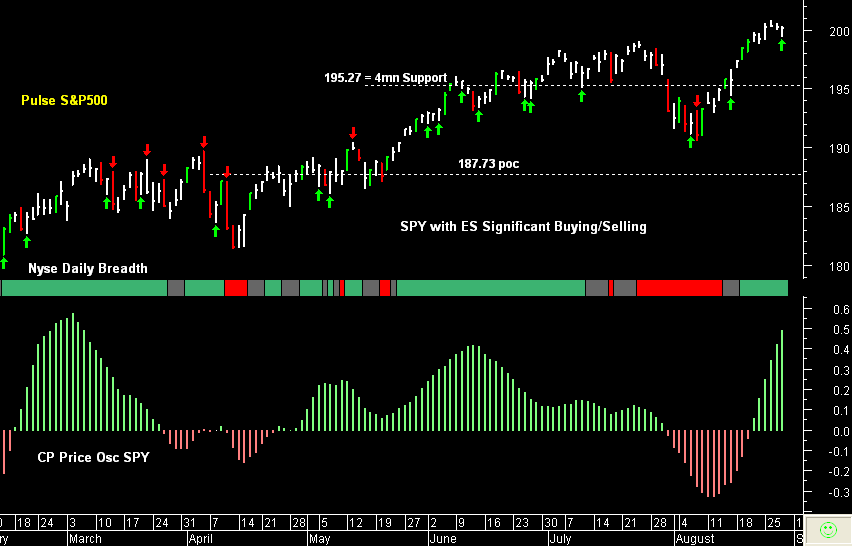
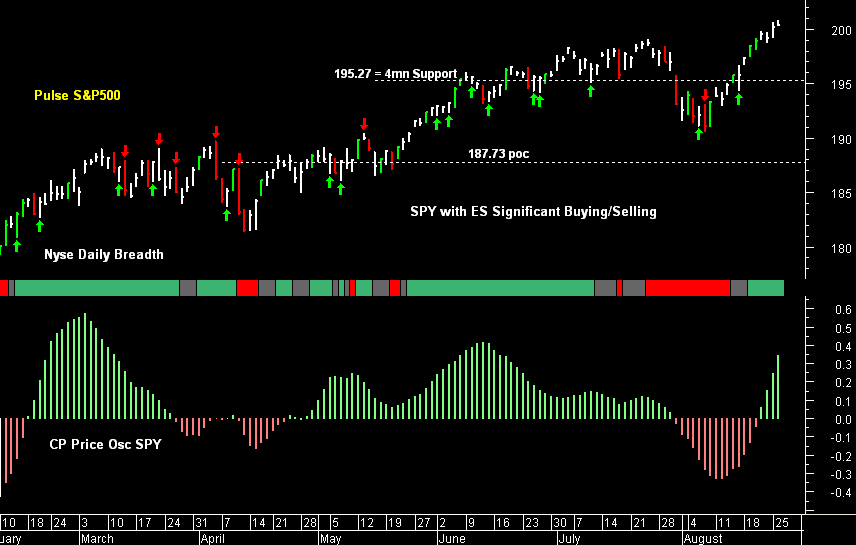
SPY pre-open Friday 29th August
S&P 500 emini pre-open Friday 29th August
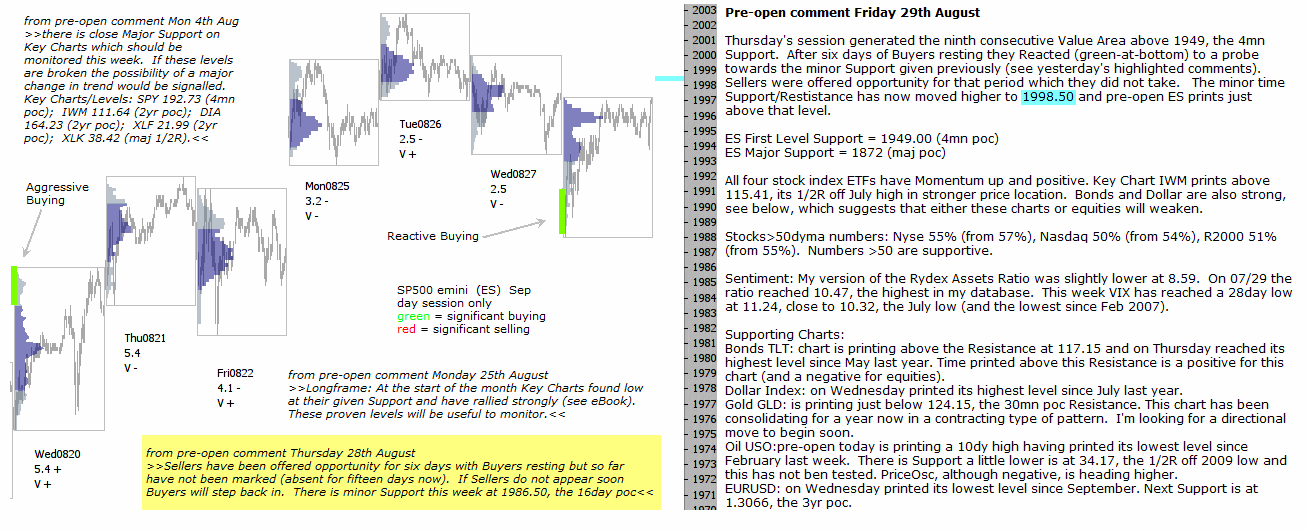
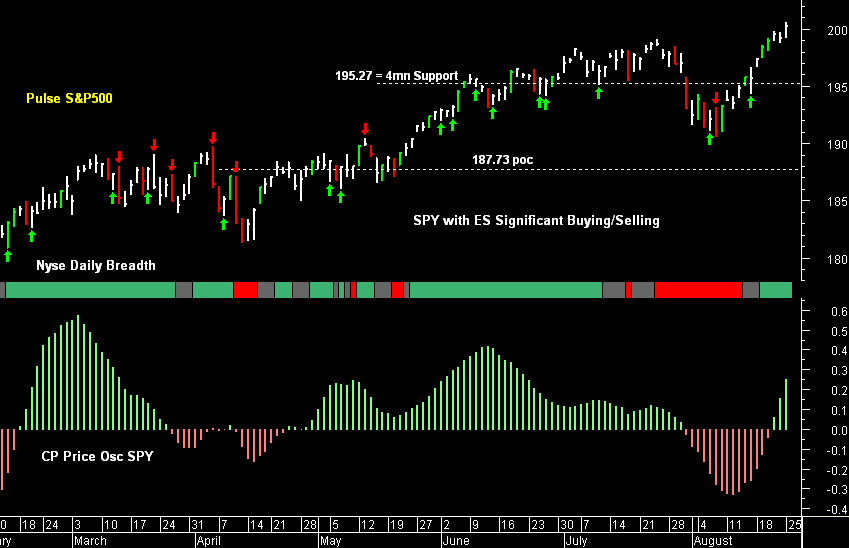
S&P 500 emini pre-open Friday 29th August posted 09.16 a.m. est Thursday's session generated the ninth consecutive Value Area above 1949, the 4mn Support. After six days of Buyers resting they Reacted (green-at-bottom) to a probe towards … [Continue reading]
S&P 500 emini pre-open Thursday 28th August
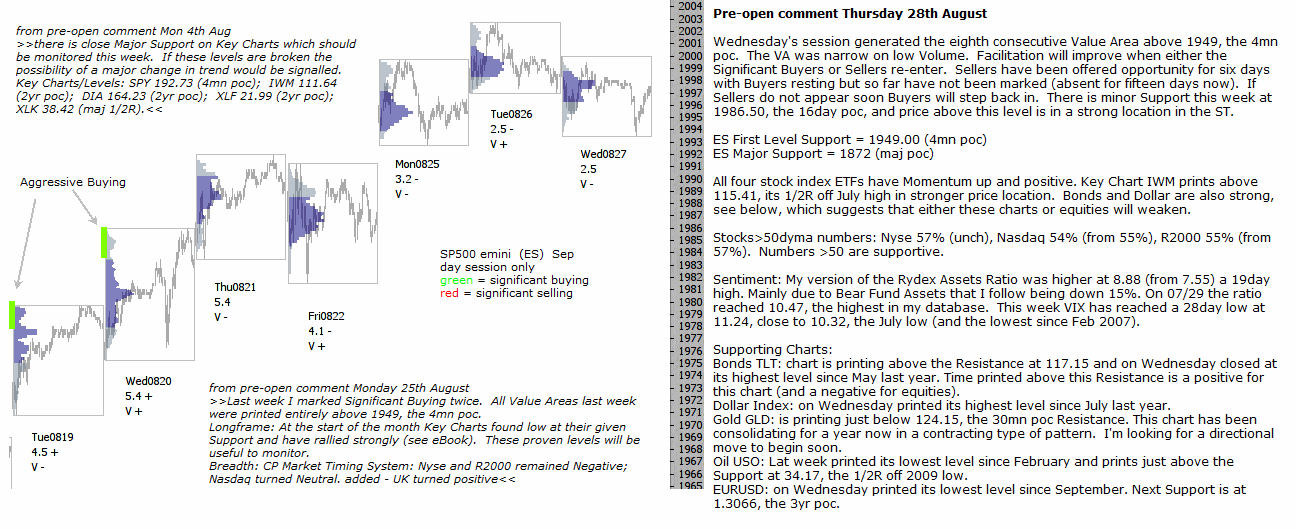
S&P 500 emini pre-open Thursday 28th August posted at 05.55 a.m. est Wednesday's session generated the eighth consecutive Value Area above 1949, the 4mn poc. The VA was narrow on low Volume. Facilitation will improve when either the … [Continue reading]
SPY pre-open Wednesday 27th August
S&P 500 emini pre-open Wednesday 27th August
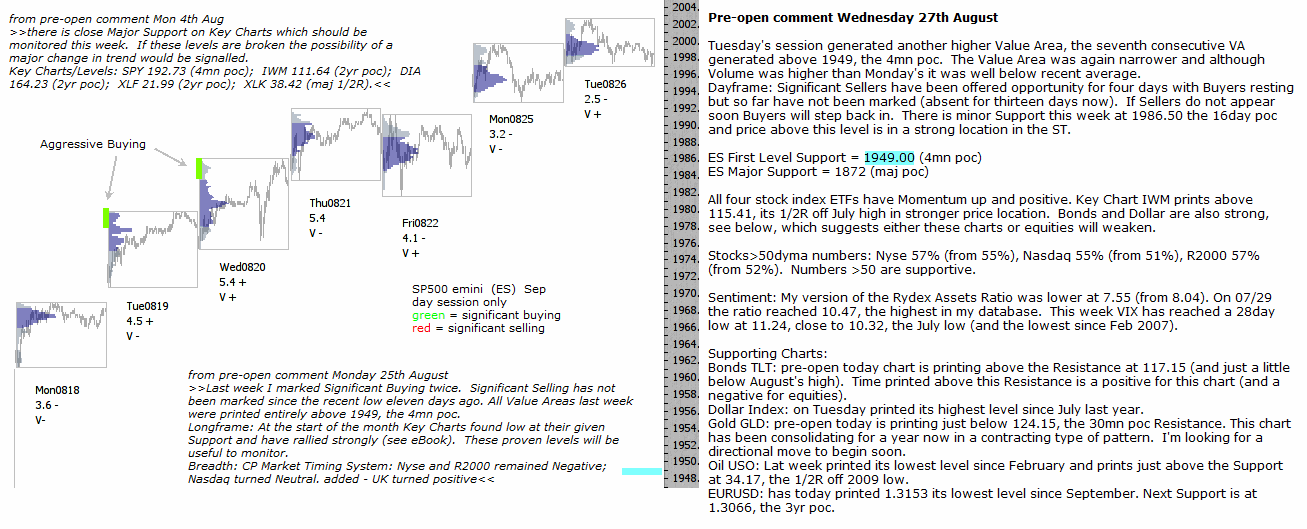
S&P 500 emini pre-open Wednesday 27th August posted 09.16 a.m. est Tuesday's session generated another higher Value Area, the seventh consecutive VA generated above 1949, the 4mn poc. The Value Area was again narrower and although Volume … [Continue reading]
SPY pre-open Tuesday 26th August
S&P 500 emini pre-open Tuesday 26th August
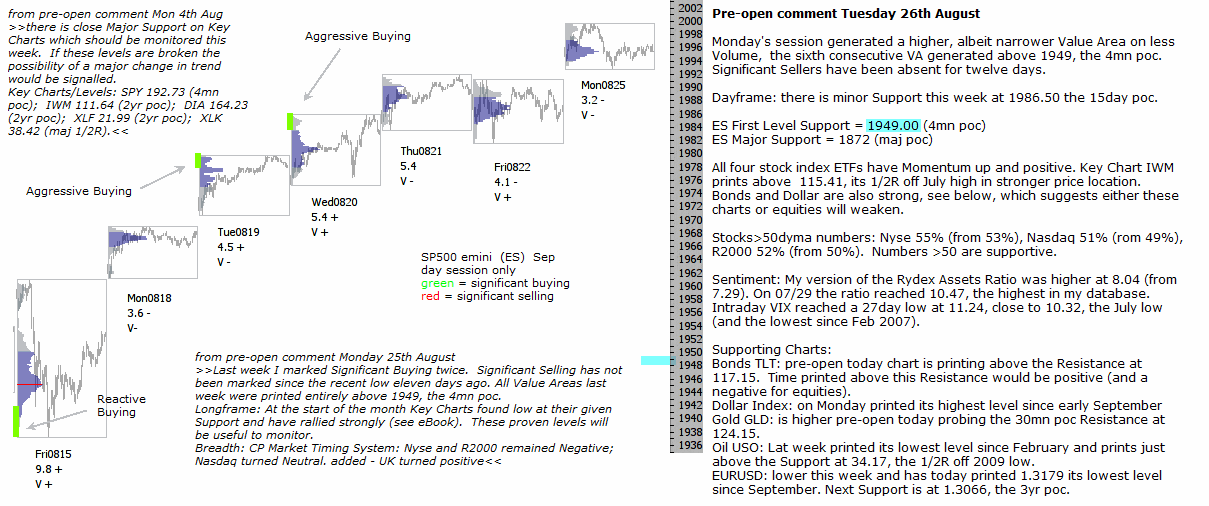
S&P 500 emini pre-open Tuesday 26th August posted at 08.56 a.m. est Monday's session generated a higher, albeit narrower Value Area on less Volume, the sixth consecutive VA generated above 1949, the 4mn poc. Significant Sellers have been … [Continue reading]
Chartprofit eBook 22nd August 2014
This week's Chartprofit eBook is available to view The DNL Reader is required to view the eBook. If you do not have this program please download it here: www.digitalwebbooks.com/reader/ *********** PRICE PERFORMANCE / LOCATION ES … [Continue reading]
- « Previous Page
- 1
- …
- 362
- 363
- 364
- 365
- 366
- …
- 556
- Next Page »