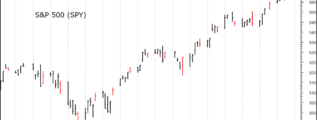
Note Fridays - daily trend remains up. … [Continue reading]
Daily analysis - Stock Market, Bonds, Forex and more
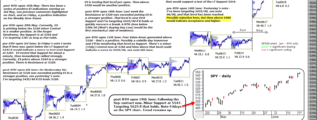
Note Fridays - daily trend remains up. … [Continue reading]
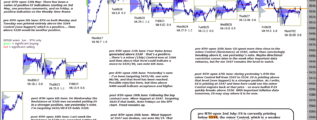
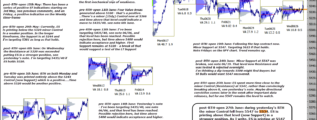
ES printed time above 5625 which indicated acceptance and higher, see note 8th July. Price relative to the minor Control at 5639.5 is worth monitoring. … [Continue reading]

from note 19th June - Minor Support at 5547. Targeting 5625 if that holds. Target at 5625 has been reached. Possible rejection here, needs monitoring - but time at or above 5625 would indicate acceptance and higher. Support at 5534. … [Continue reading]
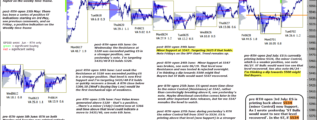
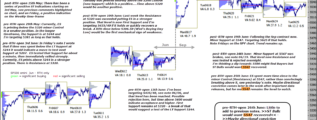
ES is printing back above 5534 (minor Control) now Support. As I wrote yesterday 'ST Bulls would want to see that level recovered'. In the ST, if 5534 holds, I'm targeting 5625, see note 19th June. … [Continue reading]
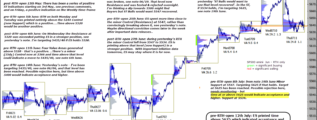
ES is currently printing below 5534, the minor Control, which is a weaker position, see note 06/27. ST Bulls would want too see that level recovered. See also note 06/24 - "I'm thinking a dip towards 5500 might find Buyers". … [Continue reading]
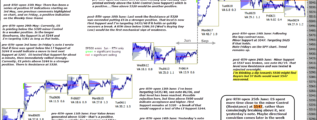
During yesterday's RTH the minor Control fell from 5547 to 5534. ES is printing above that level (now Support) in a stronger position. As I write, ES is printing at 5547 and time here could see the minor Control migrate back at that price - so more … [Continue reading]
Little to add to previous notes. 06/24 ST Bulls would want 5547 recovered. 06/25 Maybe directional conviction comes later in the week after important data releases, but for me 5547 remains the level to watch. … [Continue reading]
ES spent more time close to the minor Control (Resistance) at 5547, rather than convincingly breaking above it, see yesterday's note. Maybe directional conviction comes later in the week after important data releases, but for me 5547 remains the … [Continue reading]
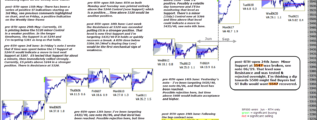
Minor Support at 5547 was broken, see note 06/19. That level now Resistance and was tested & rejected overnight. I'm thinking a dip towards 5500 might find Buyers but ST Bulls would want 5547 recovered. … [Continue reading]
Following the Sep contract now. Minor Support at 5547. Targeting 5625 if that holds. Note Fridays on the SPY chart. Trend remains up. … [Continue reading]