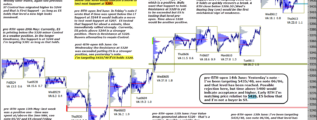
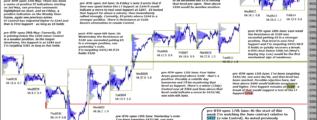
• Home

chartprofit.com

Daily analysis - Stock Market, Bonds, Forex and more

ES_F e-mini 3rd July 2023

Posted on July 3, 2023 Written by Chart Prophet

I wrote on Wednesday that a Red day (Selling) followed immediately by a Green day (Buying) is rare and usually bullish in the near term. ES has rallied from there and is currently holding a higher level, just below 4500. First Level Support on the … [Continue reading]

Filed Under: emini SP500 (ES)

ES_F e-mini 28th June 2023

Posted on June 28, 2023 Written by Chart Prophet

Sellers (red) made a mark on Monday and this brought an immediate response from the Buyers (green) on Tuesday. Red day followed immediately by a Green day is rare and usually bullish in the near term. I wrote yesterday that the 'First positive … [Continue reading]

Filed Under: emini SP500 (ES)

ES_F e-mini 27th June 2023

Posted on June 27, 2023 Written by Chart Prophet

previous note - 'Targets have been playing out on the downside'. Certainly in the minor timeframe. Also worth noting that Friday's RTH close was below the Buying Day Low on 06/15, which is another minor indication of weakness. First positive would be … [Continue reading]

Filed Under: emini SP500 (ES)

ES_F e-mini 26th June 2023

Posted on June 26, 2023 Written by Chart Prophet

I wrote in Thursday's note that 'the ST Resistance is now 4411.50 and if ES cannot print time above that level post RTH open I would target 4378'. Overnight low has been 4375.75. Targets have been playing out on the downside. The v min … [Continue reading]

Filed Under: emini SP500 (ES)

ES_F e-mini 22nd June 2023

Posted on June 22, 2023 Written by Chart Prophet

LT: see Tuesday's highlighted note on chart.ST: I wrote in yesterday's note If ES cannot print time above 4435.50 post RTH open I would target 4405. That's the way it played out and 4405 was hit. The ST Resistance is now 4411.50 and if ES cannot … [Continue reading]

Filed Under: emini SP500 (ES)

ES_F e-mini 21st June 2023

Posted on June 21, 2023 Written by Chart Prophet

I wrote in yesterday's note that ES can make a positive start today by recovering the ST Resistance at 4446. That didn't happen. Support/Resistance today has moved lower to 4435.50 and price relative to that level is worth monitoring. ST: If ES … [Continue reading]

Filed Under: emini SP500 (ES)

ES_F e-mini 20th June 2023

Posted on June 20, 2023 Written by Chart Prophet

Significant Buying (green) was marked twice last week. The weekly VA was higher and wider indicating this is Effective Buying so Buyers still in control of the longer time-frame. However, the long-term Value Area High on the daily chart, at 4477, … [Continue reading]

Filed Under: emini SP500 (ES)

ES_F e-mini 16th June 2023

Posted on June 16, 2023 Written by Chart Prophet

I'm revising the level given in yesterday's note (which was based on 30min chart). 4477 represents the long-term Value Area High on the daily chart and ES has probed this level, see the upper dashed line on chart. Rejection here would be an … [Continue reading]

Filed Under: emini SP500 (ES)

ES_F e-mini 14th June 2023

Posted on June 14, 2023 Written by Chart Prophet

Since the rejected test of the major 4137 Support on 05/24, ES has rallied strongly, see chart. Significant Selling (red) has not been marked since 05/23. Price relative to 4415 is worth monitoring today. … [Continue reading]

Filed Under: emini SP500 (ES)

ES_F e-mini 12th June 2023

Posted on June 12, 2023 Written by Chart Prophet

Strong end to the week, last week - see Friday's note. Going forward we are following the Sep contract and levels given below are for ES Sep. Note that prices on main chart (Jun) do not reflect those on the daily chart (Sep). Main chart will be … [Continue reading]

Filed Under: emini SP500 (ES)

  • « Previous Page
  • 1
  • …
  • 36
  • 37
  • 38
  • 39
  • 40
  • …
  • 539
  • Next Page »

Archives

Copyright © 2025 · Focus Pro Theme on Genesis Framework · WordPress · Log in