As per previous notes - Buyers in Control, targeting 4940. At the start of this week price relative to 4916 is worth monitoring with Support at 4882.0. … [Continue reading]
Daily analysis - Stock Market, Bonds, Forex and more
As per previous notes - Buyers in Control, targeting 4940. At the start of this week price relative to 4916 is worth monitoring with Support at 4882.0. … [Continue reading]
As per previous notes - Buyers in Control, targeting 4940, Support at 4811.50, min Support at 4882.0.Today, price relative to 4915.5 is worth monitoring. … [Continue reading]
As per previous notes - Buyers in Control, targeting 4940, Support at 4811.50, minor Support at 4882.0. … [Continue reading]
As per previous notes - Buyers in Control, targeting 4940, Support at 4811.50. Today, 4882.0 is a reference level worth monitoring. … [Continue reading]
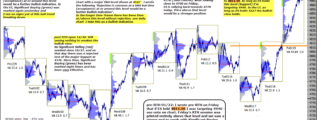
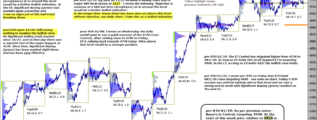
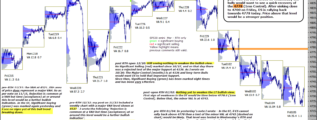
I wrote pre-RTH on Friday that if ES held 4811.50 I was targeting 4940 - see note on chart. Friday's RTH session was printed entirely above that level and we saw a strong end to week with Significant Buying (green) marked on Thu and Fri. Pre-open … [Continue reading]
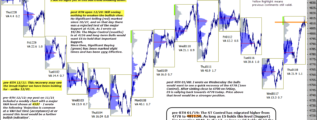
The ST Control has migrated higher from 4778 to 4811.50. As long as ES holds this level (Support) I'm targeting 4940. In the LT, as long as ES holds 4527 the bullish view holds, see previous comments on chart. … [Continue reading]
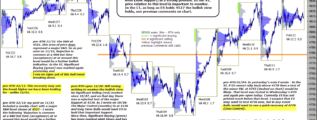
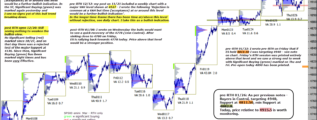
ES rallied back above 4778 (1mn Control) on 01/08, and is currently holding that level (now Support) in a strong position. In the ST, price relative to this level is important to monitor. In the LT, as long as ES holds 4527 the bullish view holds, … [Continue reading]
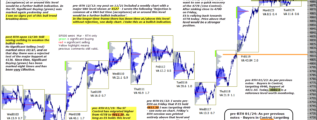
ES rallied back above 4778 (1mn Control) on Monday, see yesterday's note on chart. In the ST, price relative to this level is important to monitor. ES has dipped back below it pre-RTH but yesterday's Significant Buying (green) indicates higher. In … [Continue reading]
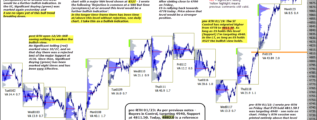
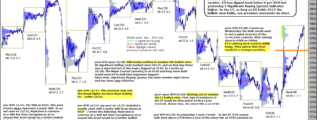
90 minutes after RTH open: I wrote on Wednesday the bulls would want to see a quick recovery of the 4778 (1mn Control). After sinking close to 4700 on Friday, ES is rallying back towards 4778 today. Price above that level would be a stronger … [Continue reading]
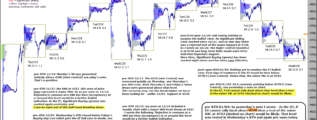
In yesterday's note I wrote - In the ST, if ES cannot rally back above 4778 then a test of the minor VAL at 4743 (dashed on chart) would be likely. That level was tested in Wednesday's RTH and again pre-open today. Currently ES has not printed … [Continue reading]