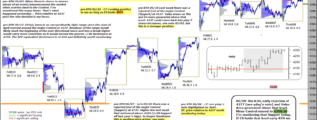
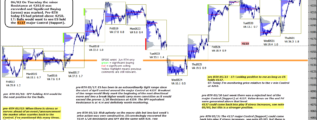
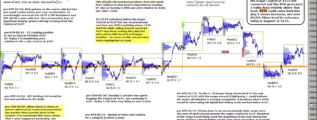
• Home

chartprofit.com

Daily analysis - Stock Market, Bonds, Forex and more

ES_F e-mini 24th August 2022

Posted on August 24, 2022 Written by Chart Prophet

There has been some movement of the Major Control depending on the time-frame used. On the daily it's at 4147, on the 30-minute it's at 4157 - hence the shaded band between these two levels on the chart. This is big picture though so Significant … [Continue reading]

Filed Under: emini SP500 (ES)

ES_F e-mini 23rd August 2022

Posted on August 23, 2022 Written by Chart Prophet

As anticipated, the 4152 Support (7mn Control) was tested - also Significant Selling (red) was marked on Monday which eliminates the long side for me, at least until Significant Buying (green) is marked again. My best guess is that 4152 will attract … [Continue reading]

Filed Under: emini SP500 (ES)

ES_F e-mini 22nd August 2022

Posted on August 22, 2022 Written by Chart Prophet

ST: Friday's RTH close was below 4257.50 (most recent Buying Day's Low - red dash on chart). As per previous notes, I therefore expect a retest of the 4152 Support (7mn Control). LT: Time below 4152 would not support a bullish outcome. … [Continue reading]

Filed Under: emini SP500 (ES)

ES_F e-mini 19th August 2022

Posted on August 19, 2022 Written by Chart Prophet

Pre RTH Open, ES is printing close to 4250. There is Resistance at 4272.0 today (10day Control). As per previous notes, a RTH close below 4257.50 (last Friday's Buying Day Low - red dash) would be first mechanical sign of weakness in the ST. Should … [Continue reading]

Filed Under: emini SP500 (ES)

ES_F e-mini 18th August 2022

Posted on August 18, 2022 Written by Chart Prophet

Buyers have been in control. Significant Selling (red) has been absent since 07/12. On Monday I marked Significant Buying (green) again. First Mechanical sign of weakness in the ST would be a RTH close below 4257.50 which is that Buying Day's Low. … [Continue reading]

Filed Under: emini SP500 (ES)

ES_F e-mini 17th August 2022

Posted on August 17, 2022 Written by Chart Prophet

On Monday I marked Significant Buying (green) again. First Mechanical sign of weakness in the ST would be a RTH close below 4257.50 which is that Buying Day's Low. Should that happen I would expect a retest of the 4152 Support (7mn Control). … [Continue reading]

Filed Under: emini SP500 (ES)

ES_F e-mini 16th August 2022

Posted on August 16, 2022 Written by Chart Prophet

ST: On Monday I marked Significant Buying (green) again. First Mechanical sign of weakness in the ST would now be a RTH close below 4257.50 which is that Buying Day's Low. LT: Second sign of weakness would be time printed below 4152.0, the 7mn … [Continue reading]

Filed Under: emini SP500 (ES)

ES_F e-mini 15th August 2022

Posted on August 15, 2022 Written by Chart Prophet

ST: On Friday I marked Significant Buying (green). Mechanical First sign of weakness in the ST would now be a RTH close below 4221.0 which is Friday's Buying Day Low. LT: Second sign of weakness would be time printed below 4152.0, the 7mn Control. … [Continue reading]

Filed Under: emini SP500 (ES)

ES_F e-mini 12th August 2022

Posted on August 12, 2022 Written by Chart Prophet

As per previous notes a RTH close below 4112.50, Buying Day low on 08/04, would be the first indication of weakness in the ST. In the ST, ES is today printing above 4215.5 which is the 1/2R off this year's high. I'm interested to see if that can … [Continue reading]

Filed Under: emini SP500 (ES)

ES_F e-mini 11th August 2022

Posted on August 11, 2022 Written by Chart Prophet

Significant Sellers still absent, see note 08/08. Wednesday's Value Area was generated above the 7mn Control at 4152. As per previous notes a RTH close below 4112.50, Buying Day low on 08/04, would be the first indication of weakness in the ST. … [Continue reading]

Filed Under: emini SP500 (ES)

  • « Previous Page
  • 1
  • …
  • 54
  • 55
  • 56
  • 57
  • 58
  • …
  • 538
  • Next Page »

Archives

Copyright © 2025 · Focus Pro Theme on Genesis Framework · WordPress · Log in