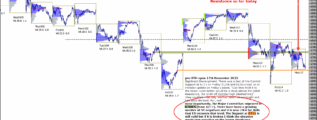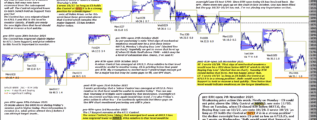
Further Development. The Major Control, which migrated to 6768.5 on Friday has very quickly fallen to 6702.5 with the time spent at that price on Monday. It is now critical for Bulls that ES recovers that level. read this post on Substack and … [Continue reading]