• Home

chartprofit.com

Daily analysis - Stock Market, Bonds, Forex and more

emini SP500 11th January 2022

Posted on January 11, 2022 Written by Chart Prophet

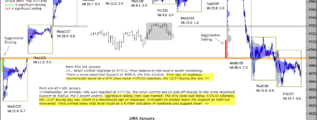
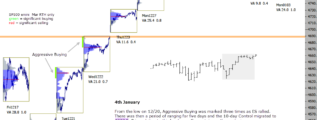
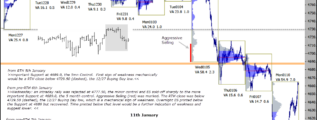
From Friday "I'm cautious here. Bulls would want to see 4689 quickly recovered". Two Value Areas generated below 4689.0, the major control. Pre-RTH ES has printed as high as 4688.25, close to that level which is currently Resistance. Time printed … [Continue reading]

Filed Under: emini SP500 (ES)

emini SP500 10th January 2022

Posted on January 10, 2022 Written by Chart Prophet

Last week a mechanical sign of weakness was triggered on Wednesday, as previously described (see comments on chart). Aggressive Selling (red) was also marked on Wednesday and ES declined to test the major control at 4689.0. I wrote pre-RTH on … [Continue reading]

Filed Under: emini SP500 (ES)

emini SP500 7th January 2022

Posted on January 7, 2022 Written by Chart Prophet

Thursday's RTH Value Area was generated above 4689.0, the 5 month control. As written yesterday Time printed below that level would be a further indication of weakness and suggest lower. We've seen Aggressive Selling (red) this week and a mechanical … [Continue reading]

Filed Under: emini SP500 (ES)

emini SP500 6th January 2021

Posted on January 6, 2022 Written by Chart Prophet

Wednesday: an intraday rally was rejected at 4777.50, the minor control, see black arrow, and ES sold-off sharply to the more important Support at 4689.0, the 5 month control. Aggressive Selling (red) was marked. The RTH close was below 4729.50, the … [Continue reading]

Filed Under: emini SP500 (ES)

emini SP500 5th January 2022

Posted on January 5, 2022 Written by Chart Prophet

From the low on 12/20, Aggressive Buying was marked three times as ES rallied. There was then a period of ranging for six days and the minor Control migrated to 4777.5. Price relative to this level is worth monitoring. There is more important … [Continue reading]

Filed Under: emini SP500 (ES)

emini SP500 4th January 2021

Posted on January 4, 2022 Written by Chart Prophet

From the low on 12/20, Aggressive Buying was marked three times as ES rallied. There was then a period of ranging for five days and the 10-day Control migrated to 4777.5. Price relative to this level, now Support, is worth monitoring. There is … [Continue reading]

Filed Under: emini SP500 (ES)

emini SP500 3rd January 2022

Posted on January 3, 2022 Written by Chart Prophet

The 10-day Control migrated to 4777.5. Price relative to this level is worth monitoring for strength/weakness at the start of this week. ES is currently printing very close. There is important Support at 4689.0, the 5mn Control. First sign of … [Continue reading]

Filed Under: emini SP500 (ES)

emini SP500 31st December 2021

Posted on December 31, 2021 Written by Chart Prophet

The 10-day Control migrated to 4788.0. Potentially Resistance. Support at 4689.0, the 5mn Control. Aggressive Buying (green) has been marked three times in the last seven days. Buyers have been Active and Effective. First sign of weakness … [Continue reading]

Filed Under: emini SP500 (ES)

emini SP500 30th December 2021

Posted on December 30, 2021 Written by Chart Prophet

The 10-day Control migrated to 4783.0. Potential Support today. More important Support at 4689.0, the 5mn Control. Aggressive Buying (green) has been marked three times in the last six days. Buyers have been Active and Effective. … [Continue reading]

Filed Under: emini SP500 (ES)

emini SP500 28th December 2021

Posted on December 28, 2021 Written by Chart Prophet

The 5mn Control migrated higher to 4689.0, pre-RTH on Thursday. Value Areas on Thursday and Friday were generated above that level. Aggressive Buying (green) has been marked three times in the last four days. Buyers have been Active and Effective and … [Continue reading]

Filed Under: emini SP500 (ES)

  • « Previous Page
  • 1
  • …
  • 87
  • 88
  • 89
  • 90
  • 91
  • …
  • 556
  • Next Page »

Archives

Copyright © 2026 · Focus Pro Theme on Genesis Framework · WordPress · Log in