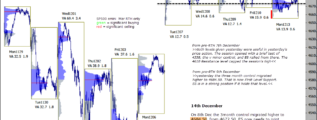
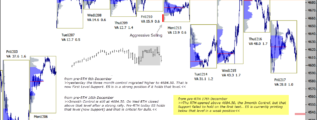
Pre-RTH the 5mn Control has migrated higher to 4689.0. ES currently prints above that level (now Support) in a strong position. Aggressive Buying marked on Tue and Wed. … [Continue reading]
Daily analysis - Stock Market, Bonds, Forex and more
Pre-RTH the 5mn Control has migrated higher to 4689.0. ES currently prints above that level (now Support) in a strong position. Aggressive Buying marked on Tue and Wed. … [Continue reading]
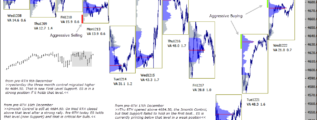
Aggressive Buying (green) was marked on Tuesday. The minor (1mn) Control migrated slightly higher to 4633, ES prints above that level pre-RTH. Resistance is at 4684.50, the 3month Control. … [Continue reading]
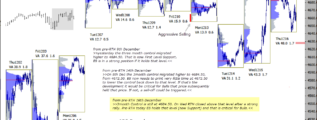
With ES printing below 4684.50, the 3month Control, I remain cautious here. There is 1month Resistance at 4627.0 and then the 1/2R Resistance off last week's high at 4637.00. … [Continue reading]
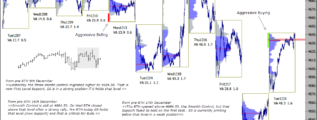
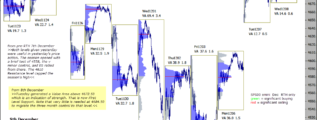
Friday generated a value Area below 4684.50, the 3month Control. Overnight ES has declined below 4530. There is no obvious Support. Best level to monitor today is a very minor reference at 4549. Time below that level could indicate lower. … [Continue reading]
Thu RTH opened above 4684.50, the 3month Control, but hat Support failed to hold on the first test, see yday's comments on chart. ES is currently printing below that level in a weak position. There is a minor reference at 4629.0 (18dy Control) and … [Continue reading]
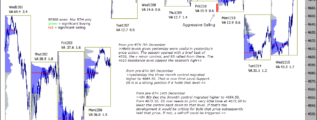
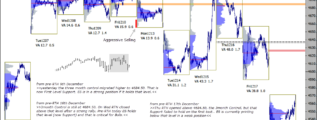
3month Control is still at 4684.50. Wed RTH closed above that level after a strong rally. Pre-RTH today ES holds that level (now Support) and that is critical for Bulls. A Value Area printed above the Control would indicate higher. … [Continue reading]
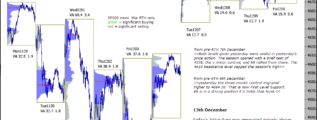
Friday's Value Area was generated entirely above 4684.50, the 3 month control, which is a minor indication of strength. Aggressive Buying (green) was marked. Pre RTH ES is printing above that level, in a strong position and Bulls would want to see … [Continue reading]
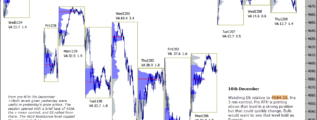
Watching ES relative to 4684.50, the 3 mn control. Pre RTH is printing above that level in a strong position but that could quickly change. Bulls would want to see that level hold as Support. … [Continue reading]
ES has shown indications of strength this week, and yesterday the three month control migrated higher to 4684.50, see previous, highlighted comments on chart. That is now First Level Support. ES is in a strong position if it holds that level. … [Continue reading]