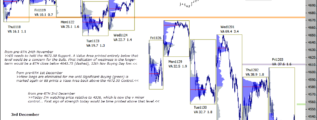
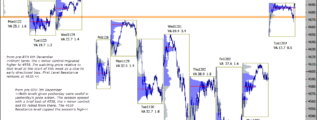
ChartProfit Chart Book - week ending 15th January 2021 … [Continue reading]
e-mini SP500 15th Jan
The 1mn controlling price for the e-mini SP500 migrated to 3797.00 on Tuesday. Value Areas on Wed and Thu were generated above that level which is a positive indication but a day-session close below 3783 (the low of Wednesday's Buying Day) would … [Continue reading]
emini ES 14th Jan
The 1mn controlling price migrated to 3797.00 on Tuesday, see yesterday's comments. Wednesday's Value Area was generated above that level and Aggressive Buying (green) was marked, both indications of strength. That view goes wrong with a day-session … [Continue reading]
emini SP500 13th Jan 2020
The 1mn controlling price has migrated to 3797.00. In the ST that's significant and price relative to that level is worth monitoring, above/below = strong/weak in the ST. In the LT, ES is in a strong position if it holds above 3672. Significant … [Continue reading]
emini SP500 ES_F 12th Jan
In the ST, ES is currently holding above 3775.0, the v min controlling price, which is a sign of ST strength, see yesterday's comments on chart. Price relative to that level is worth monitoring, above/below = strong/weak in the ST. In the LT, ES … [Continue reading]
emini 11th Jan 2021
In the LT, ES is in a strong position if it holds above 3672. Significant Selling (red) being marked below that level would be the first sign of weakness. A v min (8day) controlling price has emerged at 3775.0. Price relative to that level at the … [Continue reading]
ChartProfit Chart Book w/e 8th January 2021
ChartProfit Chart Book - week ending 8th January 2021 … [Continue reading]
emini SP500 new high
ES is in a strong position if it holds above 3672. Significant Selling (red) being marked below that level would be the first sign of weakness. Sentiment: My version of the Rydex Assets Ratio is at 18.19. Down from 21.00 reached last week, the … [Continue reading]
emini SP500 6th Jan
ES is in a strong position if it holds above 3672. Significant Selling (red) being marked below that level would be the first sign of weakness. Sentiment: My version of the Rydex Assets Ratio was lower at 18.63. Last week it reached 21.00, the … [Continue reading]
emini SP500 rejected above 3700 again
Price has once again been rejected back below 3700, please read previous, highlighted, comments on chart. ES is in a strong position if it holds above 3672. Significant Selling (red) being marked below that level would be the first sign of … [Continue reading]
- « Previous Page
- 1
- …
- 89
- 90
- 91
- 92
- 93
- …
- 531
- Next Page »