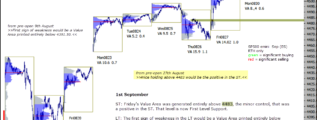
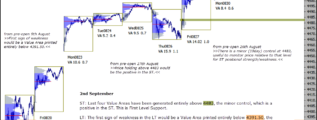
• Home

chartprofit.com

Daily analysis - Stock Market, Bonds, Forex and more

emini ES 14th Jan

Posted on January 14, 2021 Written by Chart Prophet

The 1mn controlling price migrated to 3797.00 on Tuesday, see yesterday's comments. Wednesday's Value Area was generated above that level and Aggressive Buying (green) was marked, both indications of strength. That view goes wrong with a day-session … [Continue reading]

Filed Under: emini SP500 (ES)

emini SP500 13th Jan 2020

Posted on January 13, 2021 Written by Chart Prophet

The 1mn controlling price has migrated to 3797.00. In the ST that's significant and price relative to that level is worth monitoring, above/below = strong/weak in the ST. In the LT, ES is in a strong position if it holds above 3672. Significant … [Continue reading]

Filed Under: emini SP500 (ES)

emini SP500 ES_F 12th Jan

Posted on January 12, 2021 Written by Chart Prophet

In the ST, ES is currently holding above 3775.0, the v min controlling price, which is a sign of ST strength, see yesterday's comments on chart. Price relative to that level is worth monitoring, above/below = strong/weak in the ST. In the LT, ES … [Continue reading]

Filed Under: emini SP500 (ES)

emini 11th Jan 2021

Posted on January 11, 2021 Written by Chart Prophet

In the LT, ES is in a strong position if it holds above 3672. Significant Selling (red) being marked below that level would be the first sign of weakness. A v min (8day) controlling price has emerged at 3775.0. Price relative to that level at the … [Continue reading]

Filed Under: emini SP500 (ES)

ChartProfit Chart Book w/e 8th January 2021

Posted on January 10, 2021 Written by Chart Prophet

ChartProfit Chart Book - week ending 8th January 2021 … [Continue reading]

Filed Under: emini SP500 (ES)

emini SP500 new high

Posted on January 8, 2021 Written by Chart Prophet

ES is in a strong position if it holds above 3672. Significant Selling (red) being marked below that level would be the first sign of weakness. Sentiment: My version of the Rydex Assets Ratio is at 18.19. Down from 21.00 reached last week, the … [Continue reading]

Filed Under: emini SP500 (ES)

emini SP500 6th Jan

Posted on January 6, 2021 Written by Chart Prophet

ES is in a strong position if it holds above 3672. Significant Selling (red) being marked below that level would be the first sign of weakness. Sentiment: My version of the Rydex Assets Ratio was lower at 18.63. Last week it reached 21.00, the … [Continue reading]

Filed Under: emini SP500 (ES)

emini SP500 rejected above 3700 again

Posted on January 5, 2021 Written by Chart Prophet

Price has once again been rejected back below 3700, please read previous, highlighted, comments on chart. ES is in a strong position if it holds above 3672. Significant Selling (red) being marked below that level would be the first sign of … [Continue reading]

Filed Under: emini SP500 (ES)

SP500 emini starts new year on a strong note

Posted on January 4, 2021 Written by Chart Prophet

The 3mn controlling price migrated higher to 3672 on 12/22. We then saw three Value Areas printed entirely above that level which was an indication of strength and then the gap higher at the start of last week. In the longer term, ES is in a strong … [Continue reading]

Filed Under: emini SP500 (ES)

emini SP500 31st Dec

Posted on December 31, 2020 Written by Chart Prophet

The 3mn controlling price migrated higher to 3672 early last week. We then saw three Value Areas printed entirely above that level which was an indication of strength and then Monday's VA gapped higher. Price back below 3700 from would be a negative … [Continue reading]

Filed Under: emini SP500 (ES)

  • « Previous Page
  • 1
  • …
  • 96
  • 97
  • 98
  • 99
  • 100
  • …
  • 538
  • Next Page »

Archives

Copyright © 2025 · Focus Pro Theme on Genesis Framework · WordPress · Log in