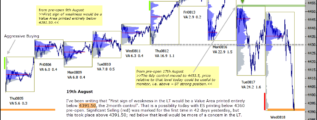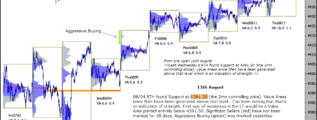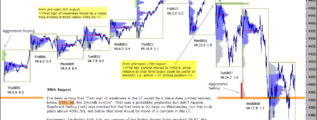
I've been writing that "First sign of weakness in the LT would be a Value Area printed entirely below 4391.50, the 2month control". That was a possibility yesterday but didn't happen. Significant Selling (red) was marked for the first time in 42 days … [Continue reading]