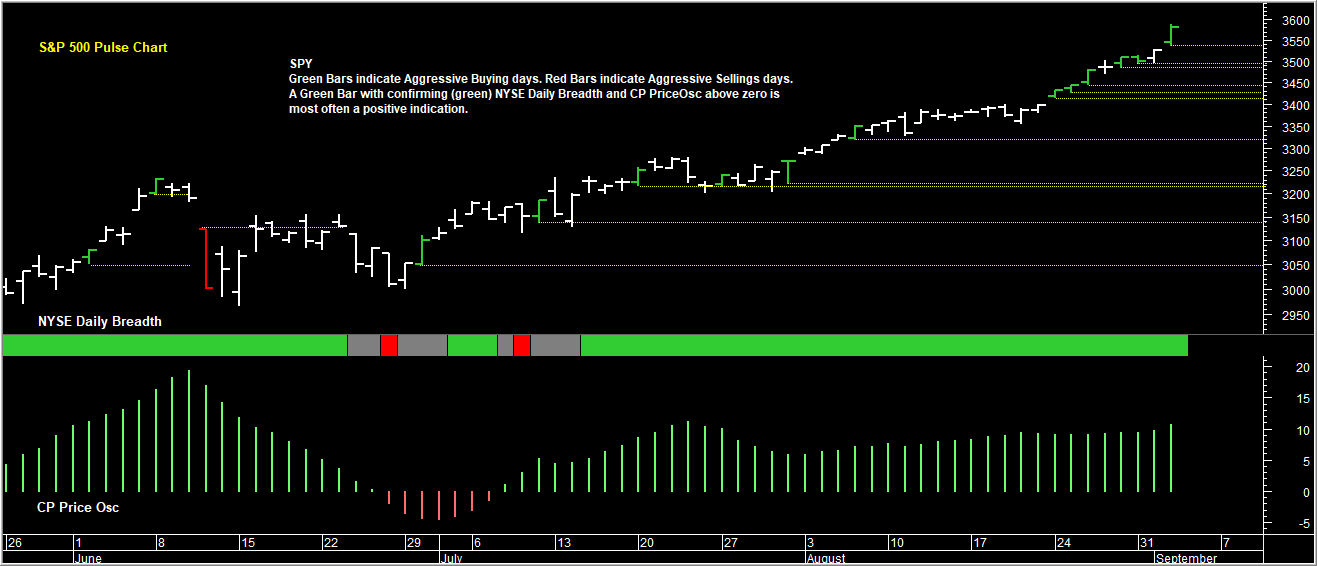
In the pre-open report today I wrote that a trading stop (daily time-frame) was now in place which is a day-session close below 3534, the low of yesterday’s Aggressive Buying day. See Green bars on Pulse Chart below which represent Aggressive Buying Days. First indication of weakness on the daily time-frame is a day-session close below the most recent Buying Day low. You can see that since this leg-up started in late June, no subsequent close has been below that moving stop level.