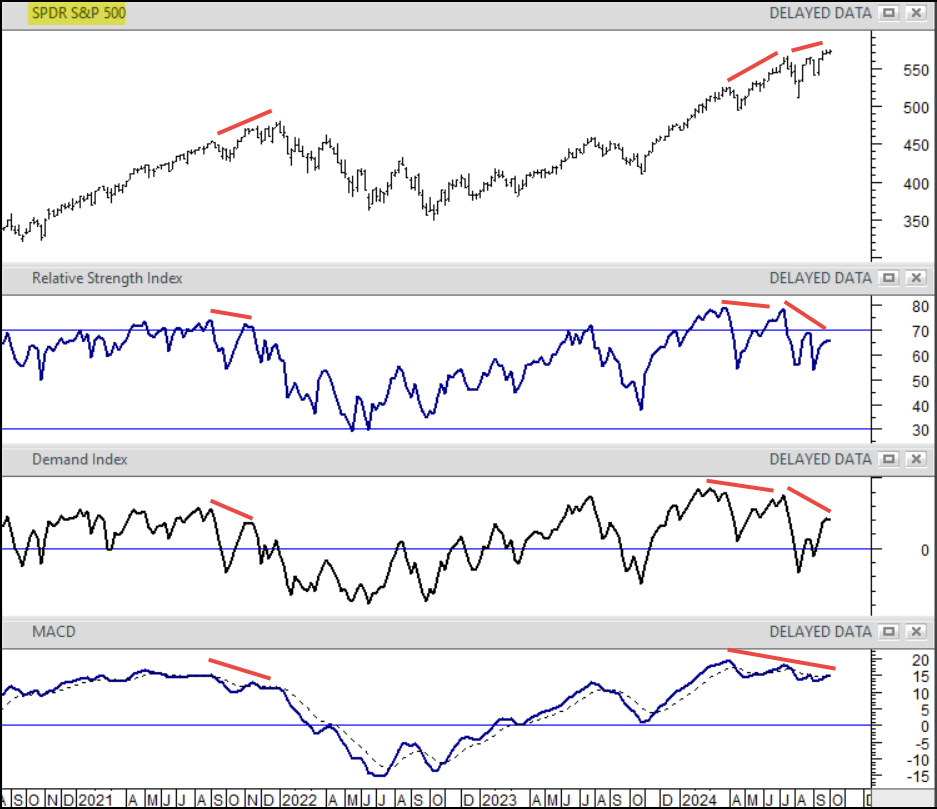
Technical oscillators on the Weekly Charts, e.g. the popular Relative Strength Index (RSI), have been negatively diverging with price action over the past few weeks, see weekly SPY chart below.
Personally, I think these ‘indicators‘ are of secondary importance compared to the distribution analysis that I post every day, but maybe a rejected upside break-out of this trading range and/or a weak Friday would carry a little more weight in my mind following such a set-up.