Are safe haven charts providing any clues for equities?
U.S. Dollar
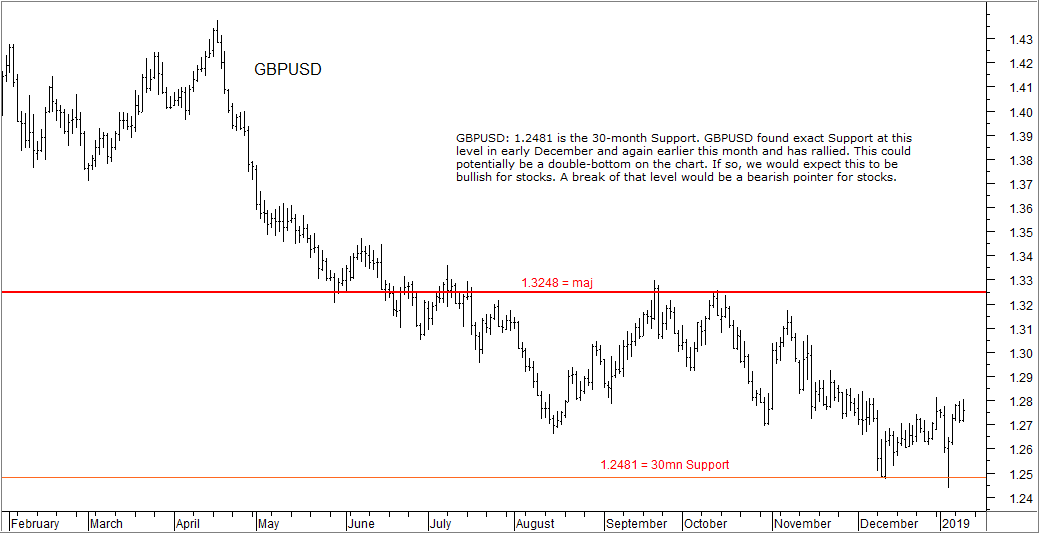
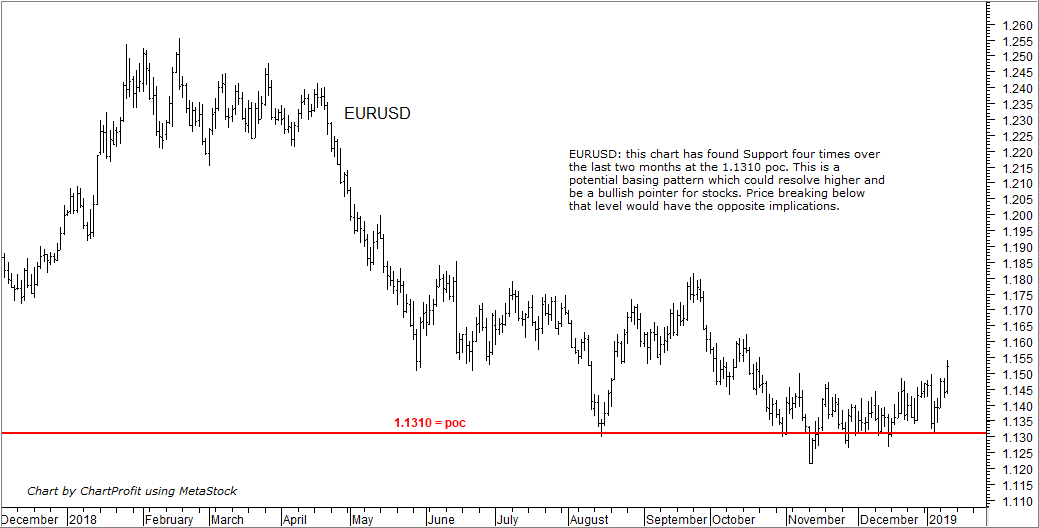
The U.S. dollar is often a safe-haven in times of stress. Stocks have fallen since September and the US Dollar Index has surged. What is interesting right now is the fact that a reversal for the dollar versus GBP and EUR is looking like a possibility, i.e. if GBPUSD and EURUSD were to rally I would take this as a positive indication for stocks.
..
GBPUSD: 1.2481 is the 30-month Support. GBPUSD found exact Support at this level in early December and again earlier this month and has rallied. This could potentially be a double-bottom on the chart. If so, we would expect this to be bullish for stocks. A break of that level would be a bearish pointer for stocks.
EURUSD: this chart has found Support four times over the last two months at the 1.1310 poc. This is a potential basing pattern which could resolve higher and be a bullish pointer for stocks. Price breaking below that level would have the opposite implications.
Gold
As mentioned, the U.S Dollar has rallied since September as equities fell. Same thing for Gold. Cash Gold has now reached its Major Resistance at 1286.50 and stalled. Again, a very clear point where this safety asset “may” reverse and turn lower. The Gold ETF (GLD) is printing above its big level at 121 – a break back below that point is worth watching for but dollar plays a role here and weakening dollar would support gold.

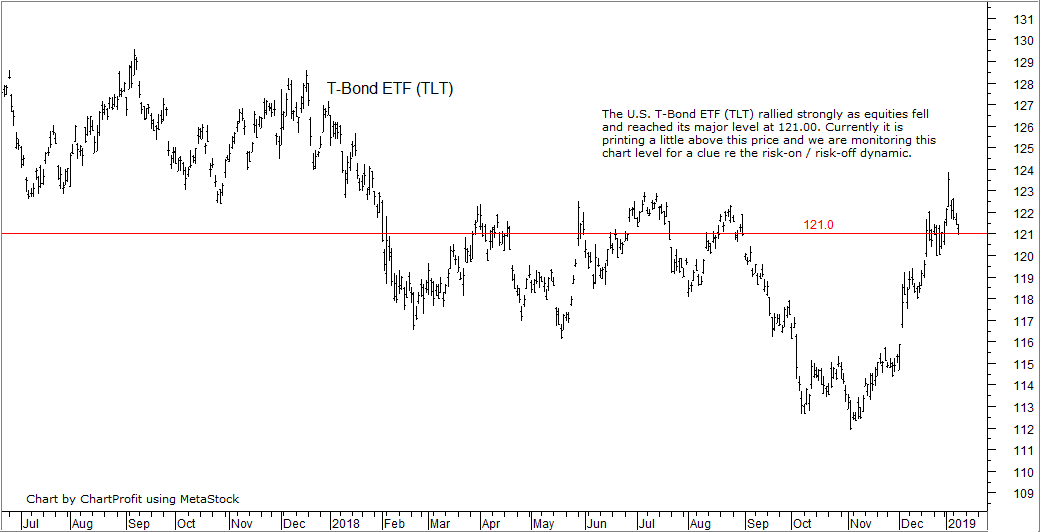
Treasury Bonds
The U.S. T-Bond ETF (TLT) rallied strongly as equities fell and reached its major level at 121.00. Currently it is printing a little above this price and I am monitoring this chart level for a clue re the risk-on / risk-off dynamic.