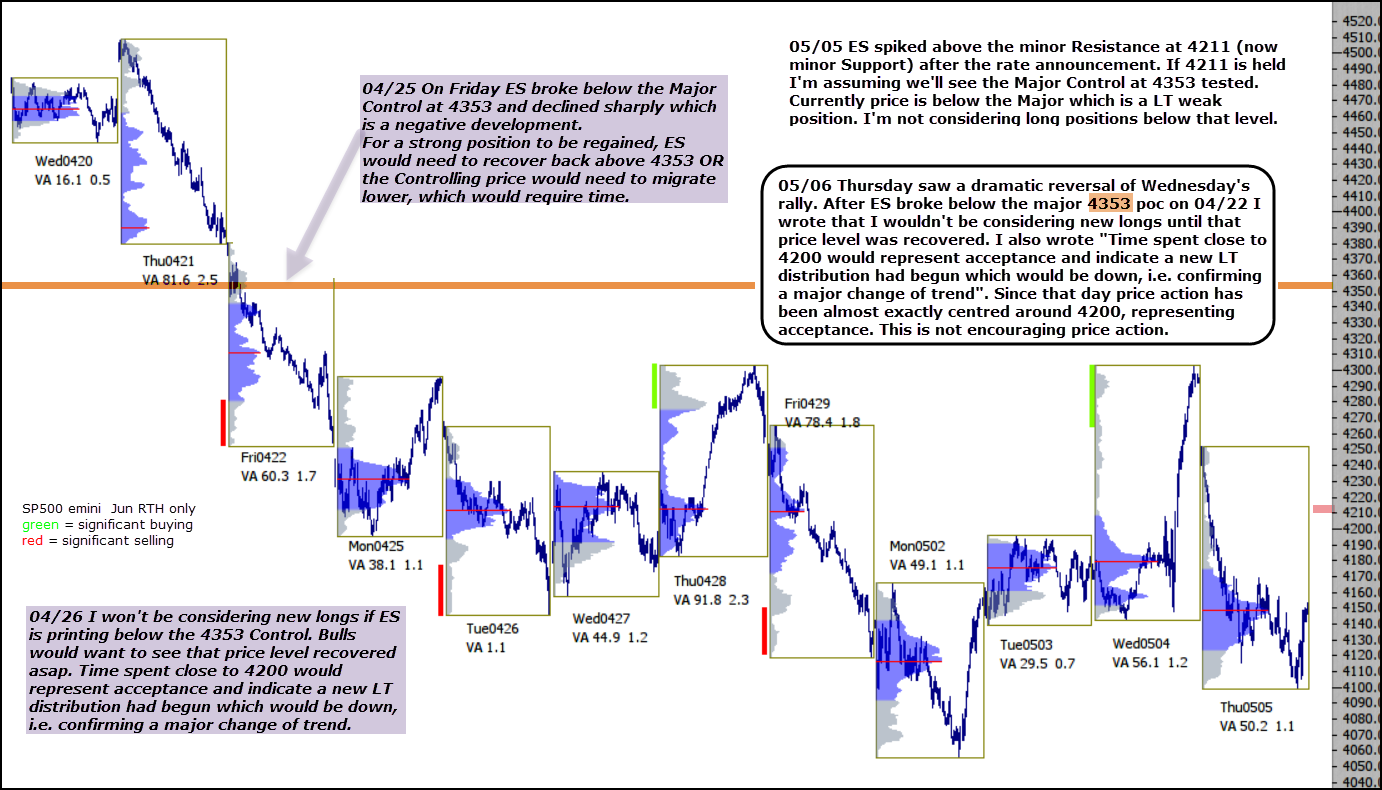
Thursday saw a dramatic reversal of Wednesday’s rally.
After ES broke below the major 4353 poc on 04/22 I wrote that I wouldn’t be considering new longs until that price level was recovered. I also wrote “Time spent close to 4200 would represent acceptance and indicate a new LT distribution had begun which would be down, i.e. confirming a major change of trend”. Since that day price action has been almost exactly centred around 4200, representing acceptance.
This is not encouraging price action.