S&P 500 emini 3rd March 2020 from ChartProfit
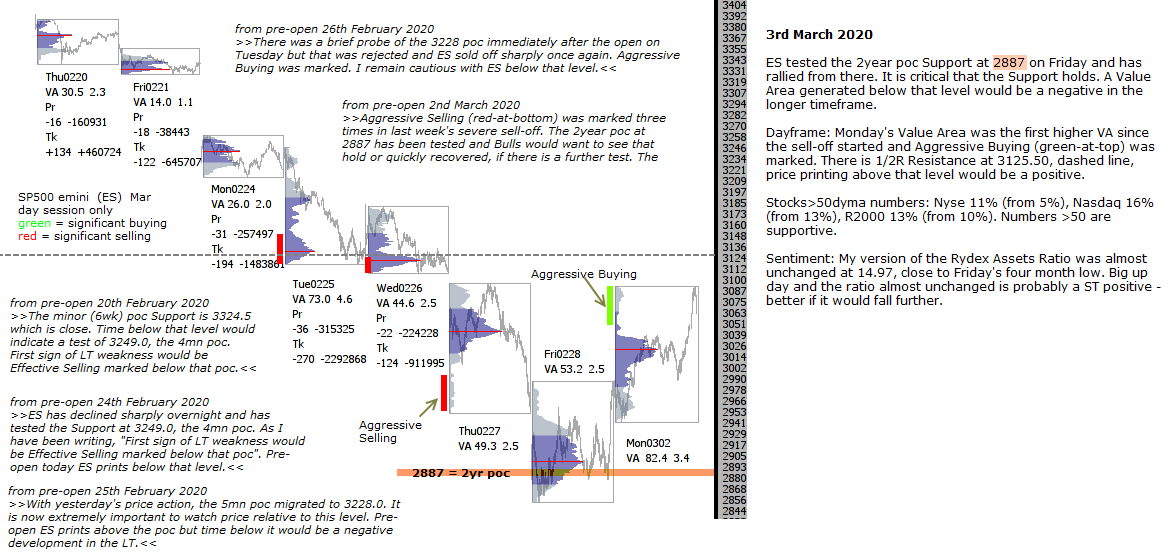
ES tested the 2year poc Support at 2887 on Friday and has rallied from there. It is critical that the Support holds. A Value Area generated below that level would be a negative in the longer timeframe.
Dayframe: Monday’s Value Area was the first higher VA since the sell-off started and Aggressive Buying (green-at-top) was marked. There is 1/2R Resistance at 3125.50, dashed line, price printing above that level would be a positive.
Stocks>50dyma numbers: Nyse 11% (from 5%), Nasdaq 16% (from 13%), R2000 13% (from 10%). Numbers >50 are supportive.
Sentiment: My version of the Rydex Assets Ratio was almost unchanged at 14.97, close to Friday’s four month low. Big up day and the ratio almost unchanged is probably a ST positive – better if it would fall further.