S&P 500 emini 7th February 2020
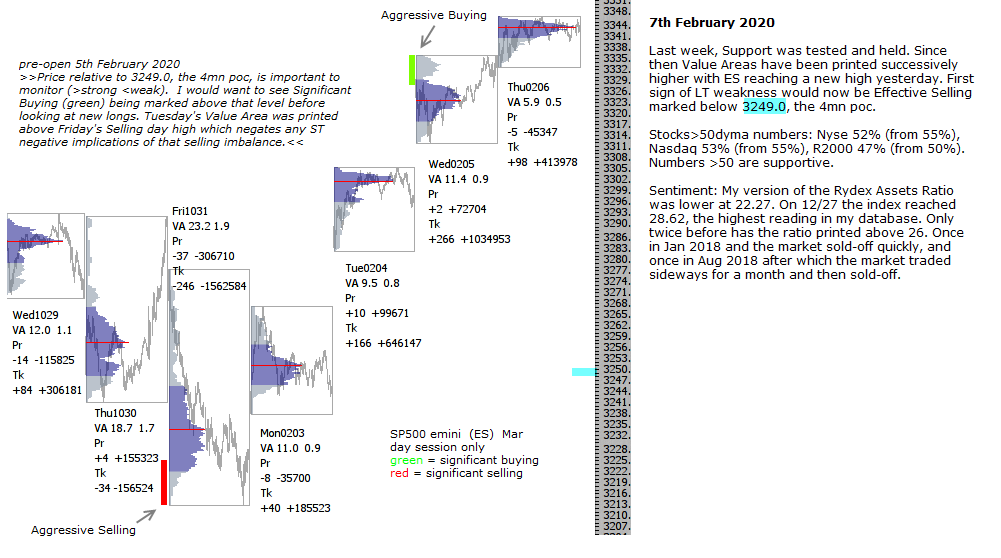
Last week, Support was tested and held. Since then Value Areas have been printed successively higher with ES reaching a new high yesterday. First sign of LT weakness would now be Effective Selling marked below 3249.0, the 4mn poc.
Stocks>50dyma numbers: Nyse 52% (from 55%), Nasdaq 53% (from 55%), R2000 47% (from 50%). Numbers >50 are supportive.
Sentiment: My version of the Rydex Assets Ratio was lower at 22.27. On 12/27 the index reached 28.62, the highest reading in my database. Only twice before has the ratio printed above 26. Once in Jan 2018 and the market sold-off quickly, and once in Aug 2018 after which the market traded sideways for a month and then sold-off.