posted 09.10 a.m. est
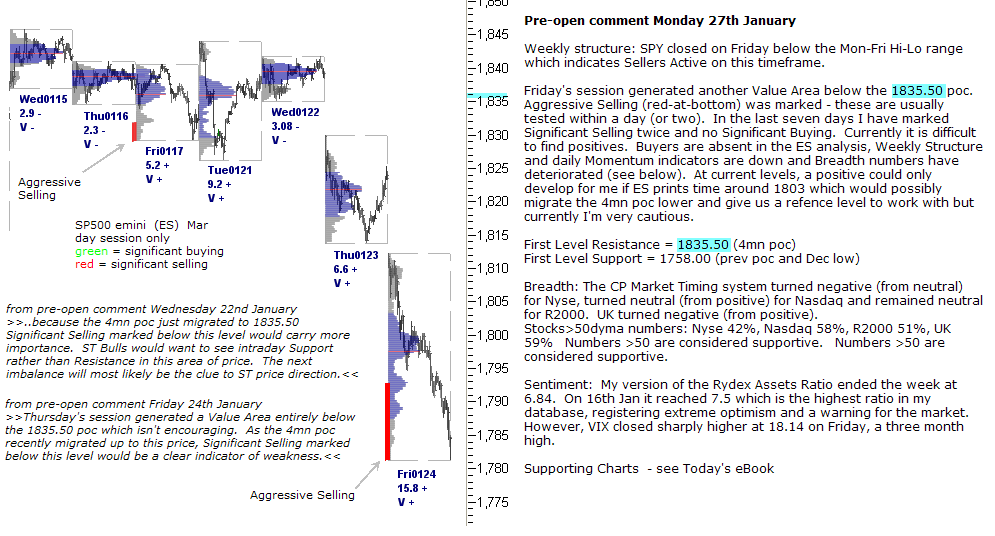
Pre-open comment Monday 27th January
Weekly structure: SPY closed on Friday below the Mon-Fri Hi-Lo range which indicates Sellers Active on this timeframe.
Friday’s session generated another Value Area below the 1835.50 poc. Aggressive Selling (red-at-bottom) was marked – these are usually tested within a day (or two). In the last seven days I have marked Significant Selling twice and no Significant Buying. Currently it is difficult to find positives. Buyers are absent in the ES analysis, Weekly Structure and daily Momentum indicators are down and Breadth numbers have deteriorated (see below). At current levels, a positive could only develop for me if ES prints time around 1803 which would possibly migrate the 4mn poc lower and give us a refence level to work with but currently I’m very cautious.
First Level Resistance = 1835.50 (4mn poc)
First Level Support = 1758.00 (prev poc and Dec low)
Breadth: The CP Market Timing system turned negative (from neutral) for Nyse, turned neutral (from positive) for Nasdaq and remained neutral for R2000. UK turned negative (from positive).
Stocks>50dyma numbers: Nyse 42%, Nasdaq 58%, R2000 51%, UK 59% Numbers >50 are considered supportive. Numbers >50 are considered supportive.
Sentiment: My version of the Rydex Assets Ratio ended the week at 6.84. On 16th Jan it reached 7.5 which is the highest ratio in my database, registering extreme optimism and a warning for the market. However, VIX closed sharply higher at 18.14 on Friday, a three month high.
Supporting Charts – see Today’s eBook