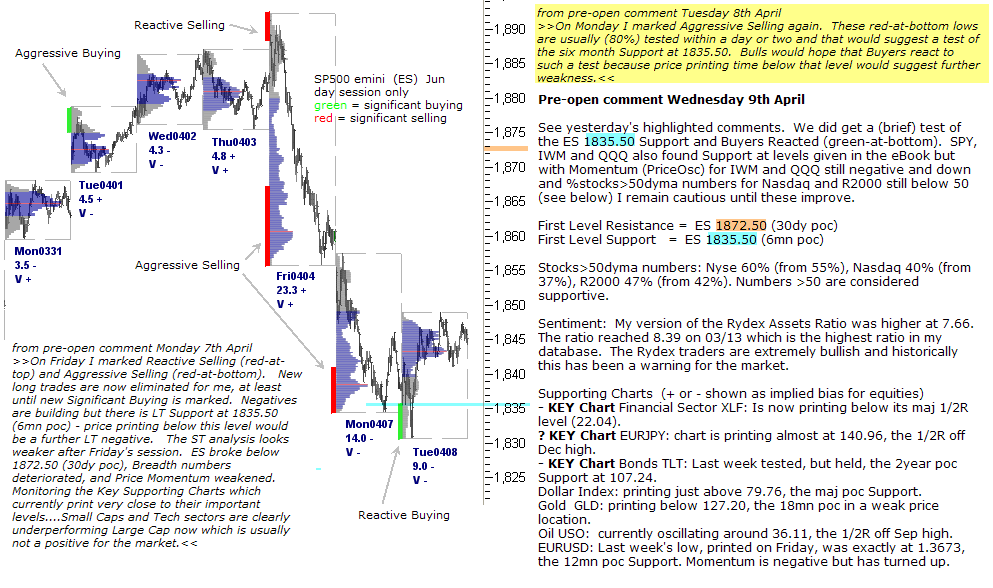
Pre-open comment Wednesday 9th April
See yesterday’s highlighted comments. We did get a (brief) test of the ES 1835.50 Support and Buyers Reacted (green-at-bottom). SPY, IWM and QQQ also found Support at levels given in the eBook but with Momentum (PriceOsc) for IWM and QQQ still negative and down and %stocks>50dyma numbers for Nasdaq and R2000 still below 50 (see below) I remain cautious until these improve.
First Level Resistance = ES 1872.50 (30dy poc)
First Level Support = ES 1835.50 (6mn poc)
Stocks>50dyma numbers: Nyse 60% (from 55%), Nasdaq 40% (from 37%), R2000 47% (from 42%). Numbers >50 are considered supportive.
Sentiment: My version of the Rydex Assets Ratio was higher at 7.66. The ratio reached 8.39 on 03/13 which is the highest ratio in my database. The Rydex traders are extremely bullish and historically this has been a warning for the market.
Supporting Charts (+ or – shown as implied bias for equities)
– KEY Chart Financial Sector XLF: Is now printing below its maj 1/2R level (22.04).
? KEY Chart EURJPY: chart is printing almost at 140.96, the 1/2R off Dec high.
– KEY Chart Bonds TLT: Last week tested, but held, the 2year poc Support at 107.24.
Dollar Index: printing just above 79.76, the maj poc Support.
Gold GLD: printing below 127.20, the 18mn poc in a weak price location.
Oil USO: currently oscillating around 36.11, the 1/2R off Sep high.
EURUSD: Last week’s low, printed on Friday, was exactly at 1.3673, the 12mn poc Support. Momentum is negative but has turned up.