S&P 500 emini pre-open Friday 11th July
posted 08 46 a.m. est
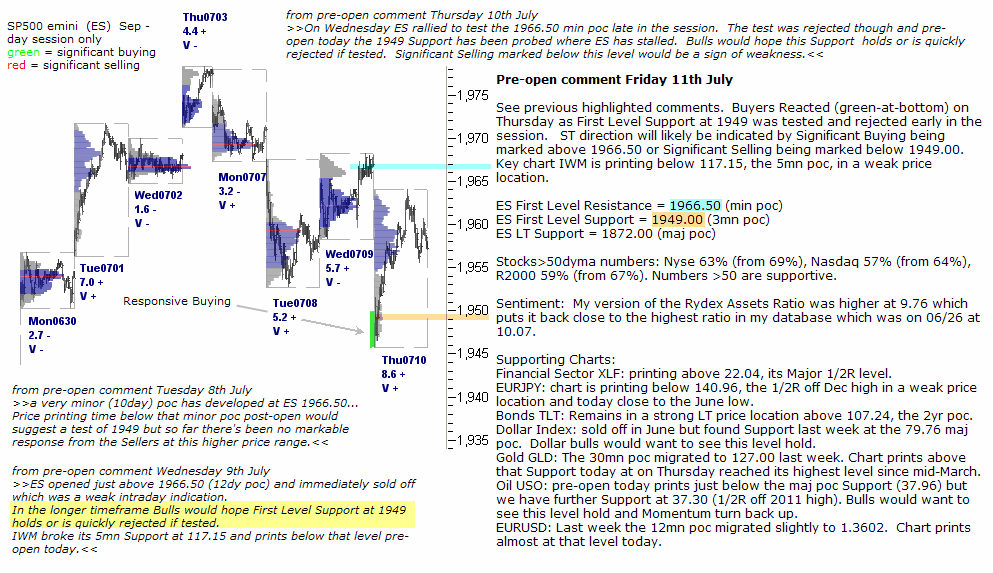
See previous highlighted comments. Buyers Reacted (green-at-bottom) on Thursday as First Level Support at 1949 was tested and rejected early in the session. ST direction will likely be indicated by Significant Buying being marked above 1966.50 or Significant Selling being marked below 1949.00. Key chart IWM is printing below 117.15, the 5mn poc, in a weak price location.
ES First Level Resistance = 1966.50 (min poc)
ES First Level Support = 1949.00 (3mn poc)
ES LT Support = 1872.00 (maj poc)
Stocks>50dyma numbers: Nyse 63% (from 69%), Nasdaq 57% (from 64%), R2000 59% (from 67%). Numbers >50 are supportive.
Sentiment: My version of the Rydex Assets Ratio was higher at 9.76 which puts it back close to the highest ratio in my database which was on 06/26 at 10.07.
Supporting Charts:
Financial Sector XLF: printing above 22.04, its Major 1/2R level.
EURJPY: chart is printing below 140.96, the 1/2R off Dec high in a weak price location and today close to the June low.
Bonds TLT: Remains in a strong LT price location above 107.24, the 2yr poc.
Dollar Index: sold off in June but found Support last week at the 79.76 maj poc. Dollar bulls would want to see this level hold.
Gold GLD: The 30mn poc migrated to 127.00 last week. Chart prints above that Support today at on Thursday reached its highest level since mid-March.
Oil USO: pre-open today prints just below the maj poc Support (37.96) but we have further Support at 37.30 (1/2R off 2011 high). Bulls would want to see this level hold and Momentum turn back up.
EURUSD: Last week the 12mn poc migrated slightly to 1.3602. Chart prints almost at that level today.