posted 08.48 a.m. est
pre-open comment Friday 11th October
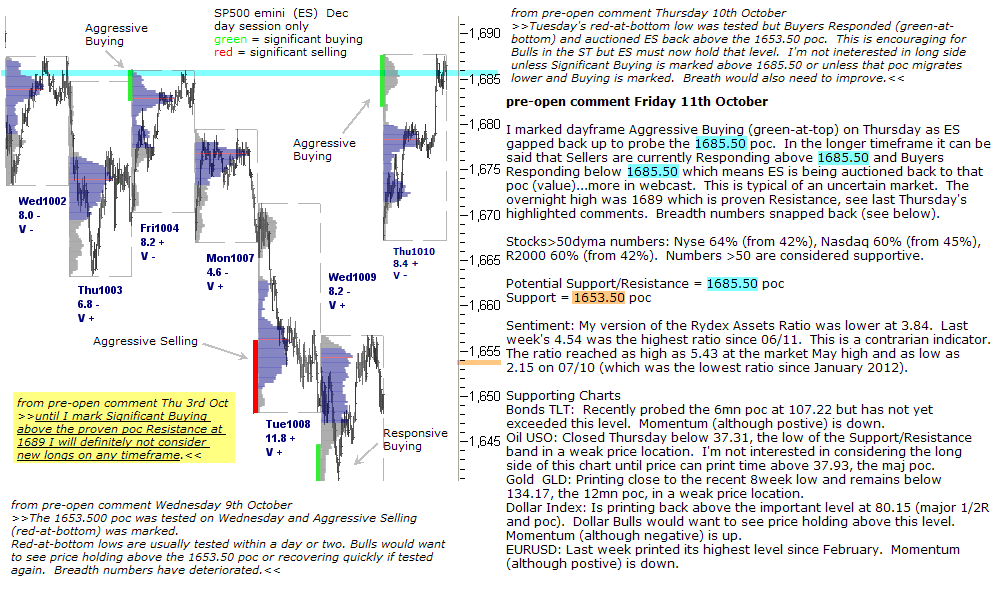
I marked dayframe Aggressive Buying (green-at-top) on Thursday as ES gapped back up to probe the 1685.50 poc. In the longer timeframe it can be said that Sellers are currently Responding above 1685.50 and Buyers Responding below 1685.50 which means ES is being auctioned back to that poc (value)…more in webcast. This is typical of an uncertain market. The overnight high was 1689 which is proven Resistance, see last Thursday’s highlighted comments. Breadth numbers snapped back (see below).
Stocks>50dyma numbers: Nyse 64% (from 42%), Nasdaq 60% (from 45%), R2000 60% (from 42%). Numbers >50 are considered supportive.
Potential Support/Resistance = 1685.50 poc
Support = 1653.50 poc
Sentiment: My version of the Rydex Assets Ratio was lower at 3.84. Last week’s 4.54 was the highest ratio since 06/11. This is a contrarian indicator. The ratio reached as high as 5.43 at the market May high and as low as 2.15 on 07/10 (which was the lowest ratio since January 2012).
Supporting Charts
Bonds TLT: Recently probed the 6mn poc at 107.22 but has not yet exceeded this level. Momentum (although postive) is down.
Oil USO: Closed Thursday below 37.31, the low of the Support/Resistance band in a weak price location. I’m not interested in considering the long side of this chart until price can print time above 37.93, the maj poc.
Gold GLD: Printing close to the recent 8week low and remains below 134.17, the 12mn poc, in a weak price location.
Dollar Index: Is printing back above the important level at 80.15 (major 1/2R and poc). Dollar Bulls would want to see price holding above this level. Momentum (although negative) is up.
EURUSD: Last week printed its highest level since February. Momentum (although postive) is down.