S&P 500 emini pre-open Friday 12th December
posted 09.15 a.m. est
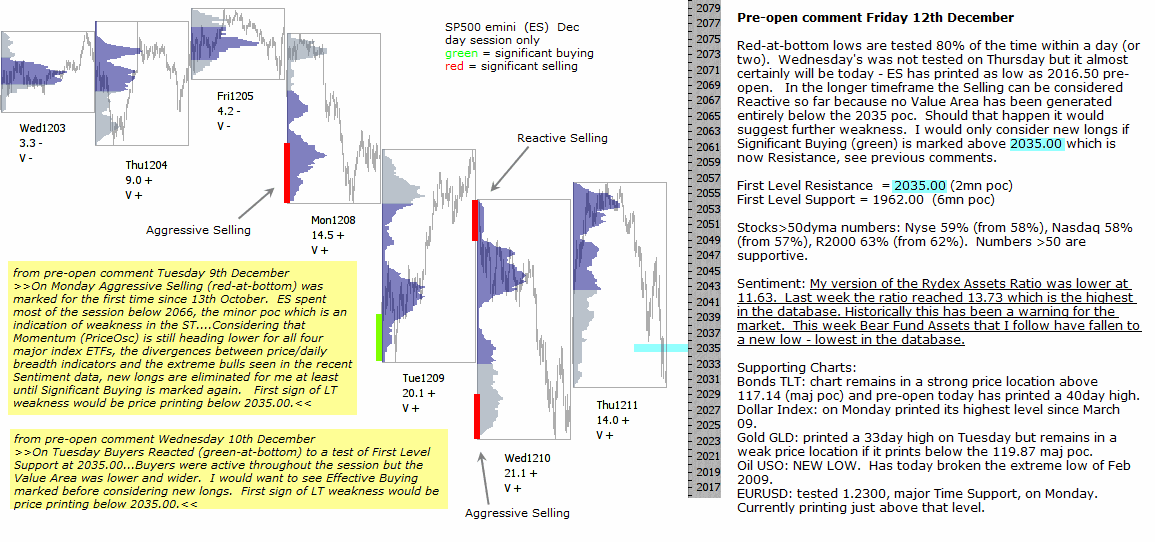
Red-at-bottom lows are tested 80% of the time within a day (or two). Wednesday’s was not tested on Thursday but it almost certainly will be today – ES has printed as low as 2016.50 pre-open. In the longer timeframe the Selling can be considered Reactive so far because no Value Area has been generated entirely below the 2035 poc. Should that happen it would suggest further weakness. I would only consider new longs if Significant Buying (green) is marked above 2035.00 which is now Resistance, see previous comments.
First Level Resistance = 2035.00 (2mn poc)
First Level Support = 1962.00 (6mn poc)
Stocks>50dyma numbers: Nyse 59% (from 58%), Nasdaq 58% (from 57%), R2000 63% (from 62%). Numbers >50 are supportive.
Sentiment: My version of the Rydex Assets Ratio was lower at 11.63. Last week the ratio reached 13.73 which is the highest in the database. Historically this has been a warning for the market. This week Bear Fund Assets that I follow have fallen to a new low – lowest in the database.
Supporting Charts:
Bonds TLT: chart remains in a strong price location above 117.14 (maj poc) and pre-open today has printed a 40day high.
Dollar Index: on Monday printed its highest level since March 09.
Gold GLD: printed a 33day high on Tuesday but remains in a weak price location if it prints below the 119.87 maj poc.
Oil USO: NEW LOW. Has today broken the extreme low of Feb 2009.
EURUSD: tested 1.2300, major Time Support, on Monday. Currently printing just above that level.