S&P 500 emini pre-open Friday 13th June
Posted 09.07 a.m. est
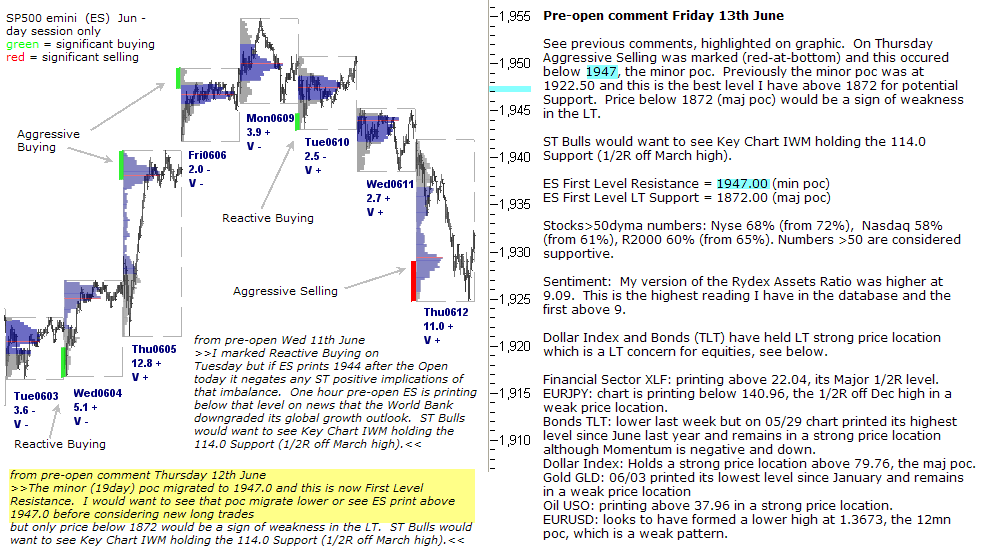
See previous comments, highlighted on graphic. On Thursday Aggressive Selling was marked (red-at-bottom) and this occured below 1947, the minor poc. Previously the minor poc was at 1922.50 and this is the best level I have above 1872 for potential Support. Price below 1872 (maj poc) would be a sign of weakness in the LT.
ST Bulls would want to see Key Chart IWM holding the 114.0 Support (1/2R off March high).
ES First Level Resistance = 1947.00 (min poc)
ES First Level LT Support = 1872.00 (maj poc)
Stocks>50dyma numbers: Nyse 68% (from 72%), Nasdaq 58% (from 61%), R2000 60% (from 65%). Numbers >50 are considered supportive.
Sentiment: My version of the Rydex Assets Ratio was higher at 9.09. This is the highest reading I have in the database and the first above 9.
Dollar Index and Bonds (TLT) have held LT strong price location which is a LT concern for equities, see below.
Financial Sector XLF: printing above 22.04, its Major 1/2R level.
EURJPY: chart is printing below 140.96, the 1/2R off Dec high in a weak price location.
Bonds TLT: lower last week but on 05/29 chart printed its highest level since June last year and remains in a strong price location although Momentum is negative and down.
Dollar Index: Holds a strong price location above 79.76, the maj poc.
Gold GLD: 06/03 printed its lowest level since January and remains in a weak price location
Oil USO: printing above 37.96 in a strong price location.
EURUSD: looks to have formed a lower high at 1.3673, the 12mn poc, which is a weak pattern.