S&P 500 emini pre-open Friday 19th September
posted 09.12 a.m. est
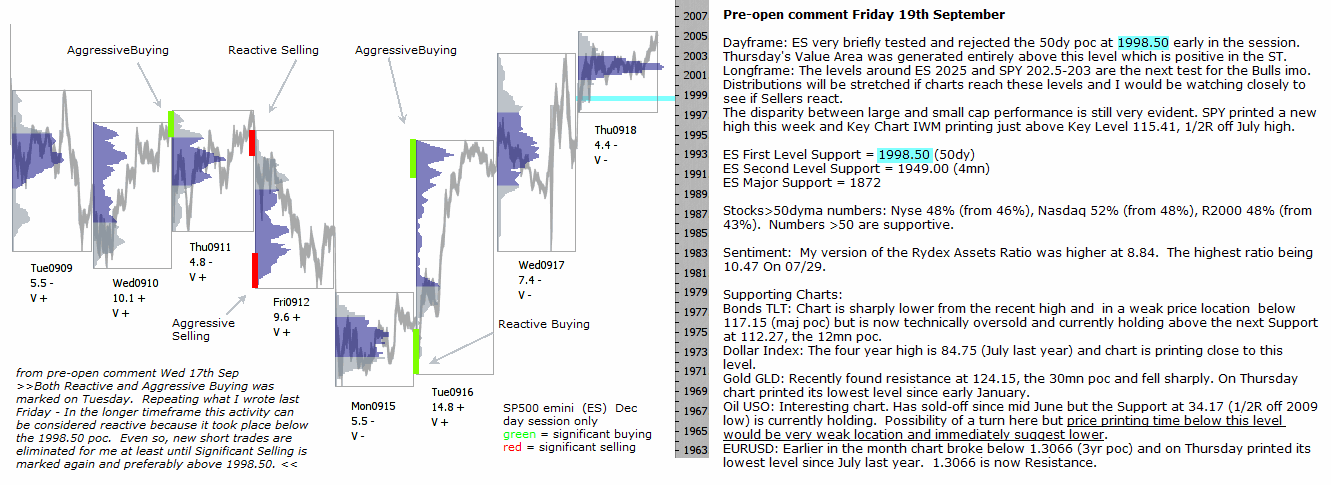
Dayframe: ES very briefly tested and rejected the 50dy poc at 1998.50 early in the session. Thursday’s Value Area was generated entirely above this level which is positive in the ST.
Longframe: The levels around ES 2025 and SPY 202.5-203 are the next test for the Bulls imo. Distributions will be stretched if charts reach these levels and I would be watching closely to see if Sellers react.
The disparity between large and small cap performance is still very evident. SPY printed a new high this week and Key Chart IWM printing just above Key Level 115.41, 1/2R off July high.
ES First Level Support = 1998.50 (50dy)
ES Second Level Support = 1949.00 (4mn)
ES Major Support = 1872
Stocks>50dyma numbers: Nyse 48% (from 46%), Nasdaq 52% (from 48%), R2000 48% (from 43%). Numbers >50 are supportive.
Sentiment: My version of the Rydex Assets Ratio was higher at 8.84. The highest ratio being 10.47 On 07/29.
Supporting Charts:
Bonds TLT: Chart is sharply lower from the recent high and in a weak price location below 117.15 (maj poc) but is now technically oversold and currently holding above the next Support at 112.27, the 12mn poc.
Dollar Index: The four year high is 84.75 (July last year) and chart is printing close to this level.
Gold GLD: Recently found resistance at 124.15, the 30mn poc and fell sharply. On Thursday chart printed its lowest level since early January.
Oil USO: Interesting chart. Has sold-off since mid June but the Support at 34.17 (1/2R off 2009 low) is currently holding. Possibility of a turn here but price printing time below this level would be very weak location and immediately suggest lower.
EURUSD: Earlier in the month chart broke below 1.3066 (3yr poc) and on Thursday printed its lowest level since July last year. 1.3066 is now Resistance.