S&P 500 emini pre-open Monday 14th July
posted 09.15 a.m. est
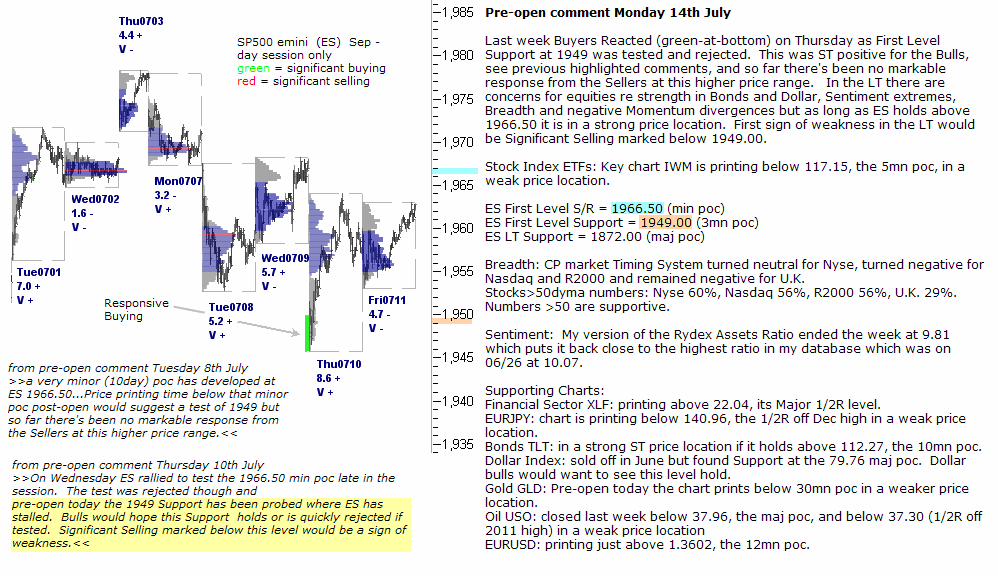
Last week Buyers Reacted (green-at-bottom) on Thursday as First Level Support at 1949 was tested and rejected. This was ST positive for the Bulls, see previous highlighted comments, and so far there’s been no markable response from the Sellers at this higher price range. In the LT there are concerns for equities re strength in Bonds and Dollar, Sentiment extremes, Breadth and negative Momentum divergences but as long as ES holds above 1966.50 it is in a strong price location. First sign of weakness in the LT would be Significant Selling marked below 1949.00.
Stock Index ETFs: Key chart IWM is printing below 117.15, the 5mn poc, in a weak price location.
ES First Level S/R = 1966.50 (min poc)
ES First Level Support = 1949.00 (3mn poc)
ES LT Support = 1872.00 (maj poc)
Breadth: CP market Timing System turned neutral for Nyse, turned negative for Nasdaq and R2000 and remained negative for U.K.
Stocks>50dyma numbers: Nyse 60%, Nasdaq 56%, R2000 56%, U.K. 29%. Numbers >50 are supportive.
Sentiment: My version of the Rydex Assets Ratio ended the week at 9.81 which puts it back close to the highest ratio in my database which was on 06/26 at 10.07.
Supporting Charts:
Financial Sector XLF: printing above 22.04, its Major 1/2R level.
EURJPY: chart is printing below 140.96, the 1/2R off Dec high in a weak price location.
Bonds TLT: in a strong ST price location if it holds above 112.27, the 10mn poc.
Dollar Index: sold off in June but found Support at the 79.76 maj poc. Dollar bulls would want to see this level hold.
Gold GLD: Pre-open today the chart prints below 30mn poc in a weaker price location.
Oil USO: closed last week below 37.96, the maj poc, and below 37.30 (1/2R off 2011 high) in a weak price location
EURUSD: printing just above 1.3602, the 12mn poc.