posted 09.22 a.m. est
Pre-open comment Friday 16th May
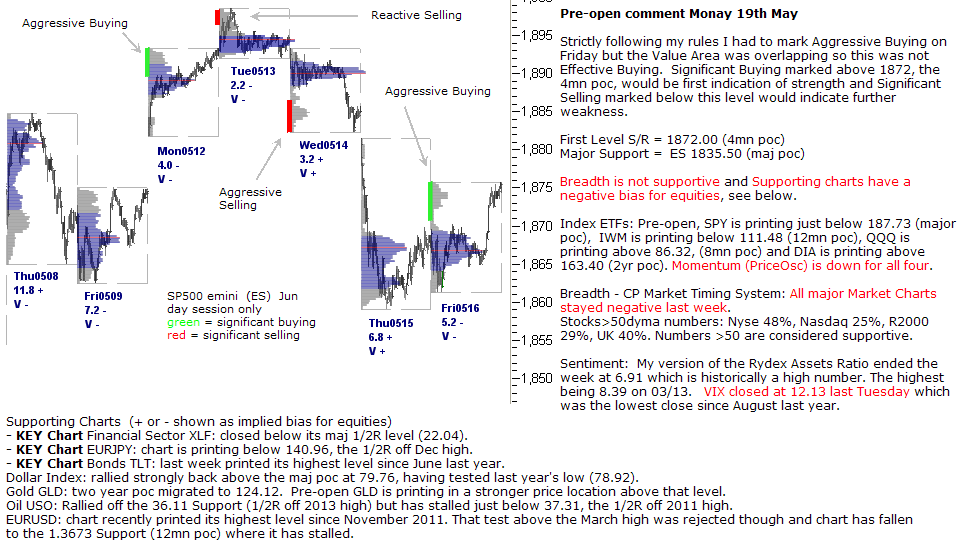
Strictly following my rules I had to mark Aggressive Buying on Friday but the Value Area was overlapping so this was not Effective Buying. Significant Buying marked above 1872, the 4mn poc, would be first indication of strength and Significant Selling marked below this level would indicate further weakness.
First Level S/R = 1872.00 (4mn poc)
Major Support = ES 1835.50 (maj poc)
Breadth is not supportive and Supporting charts have a negative bias for equities, see below.
Index ETFs: Pre-open, SPY is printing just below 187.73 (major poc), IWM is printing below 111.48 (12mn poc), QQQ is printing above 86.32, (8mn poc) and DIA is printing above 163.40 (2yr poc). Momentum (PriceOsc) is down for all four.
Breadth – CP Market Timing System: All major Market Charts stayed negative last week.
Stocks>50dyma numbers: Nyse 48%, Nasdaq 25%, R2000 29%, UK 40%. Numbers >50 are considered supportive.
Sentiment: My version of the Rydex Assets Ratio ended the week at 6.91 which is historically a high number. The highest being 8.39 on 03/13. VIX closed at 12.13 last Tuesday which was the lowest close since August last year.
Supporting Charts (+ or – shown as implied bias for equities)
– KEY Chart Financial Sector XLF: closed below its maj 1/2R level (22.04).
– KEY Chart EURJPY: chart is printing below 140.96, the 1/2R off Dec high.
– KEY Chart Bonds TLT: last week printed its highest level since June last year.
Dollar Index: rallied strongly back above the maj poc at 79.76, having tested last year’s low (78.92).
Gold GLD: two year poc migrated to 124.12. Pre-open GLD is printing in a stronger price location above that level.
Oil USO: Rallied off the 36.11 Support (1/2R off 2013 high) but has stalled just below 37.31, the 1/2R off 2011 high.
EURUSD: chart recently printed its highest level since November 2011. That test above the March high was rejected though and chart has fallen to the 1.3673 Support (12mn poc) where it has stalled.