posted 09.17 a.m. est
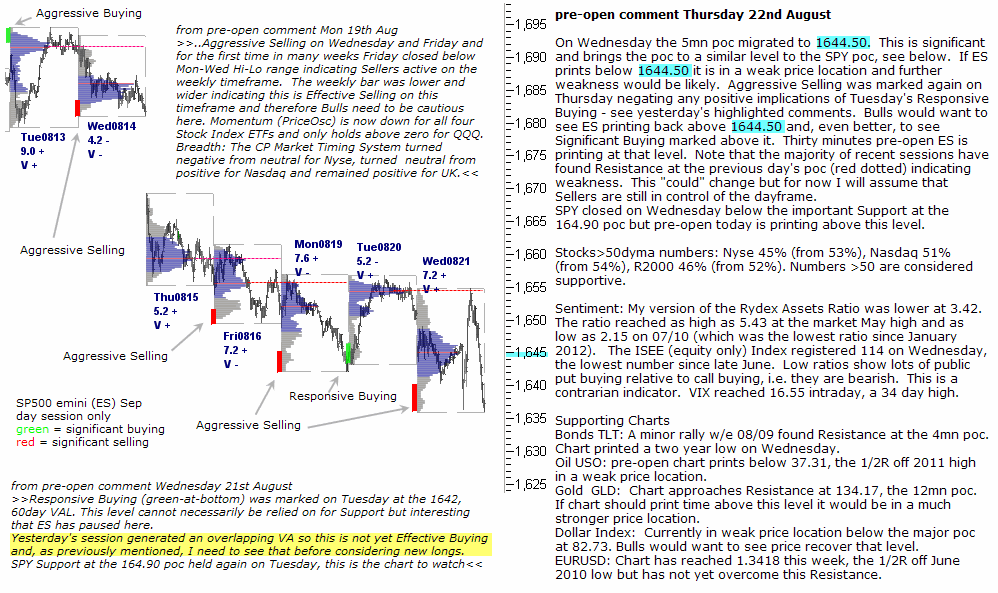
pre-open comment Thursday 22nd August
On Wednesday the 5mn poc migrated to 1644.50. This is significant and brings the poc to a similar level to the SPY poc, see below. If ES prints below 1644.50 it is in a weak price location and further weakness would be likely. Aggressive Selling was marked again on Thursday negating any positive implications of Tuesday’s Responsive Buying – see yesterday’s highlighted comments. Bulls would want to see ES printing back above 1644.50 and, even better, to see Significant Buying marked above it. Thirty minutes pre-open ES is printing at that level. Note that the majority of recent sessions have found Resistance at the previous day’s poc (red dotted) indicating weakness. This “could” change but for now I will assume that Sellers are still in control of the dayframe.
SPY closed on Wednesday below the important Support at the 164.90 poc but pre-open today is printing above this level. Interested to see if SPY can show any strength from here, a test-down and rejection of a poc can be bullish.
Stocks>50dyma numbers: Nyse 45% (from 53%), Nasdaq 51% (from 54%), R2000 46% (from 52%). Numbers >50 are considered supportive.
Sentiment: My version of the Rydex Assets Ratio was lower at 3.42. The ratio reached as high as 5.43 at the market May high and as low as 2.15 on 07/10 (which was the lowest ratio since January 2012). The ISEE (equity only) Index registered 114 on Wednesday, the lowest number since late June. Low ratios show lots of public put buying relative to call buying, i.e. they are bearish. This is a contrarian indicator. VIX reached 16.55 intraday, a 34 day high.
Supporting Charts
Bonds TLT: A minor rally w/e 08/09 found Resistance at the 4mn poc. Chart printed a two year low on Wednesday.
Oil USO: pre-open chart prints below 37.31, the 1/2R off 2011 high in a weak price location.
Gold GLD: Chart approaches Resistance at 134.17, the 12mn poc. If chart should print time above this level it would be in a much stronger price location.
Dollar Index: Currently in weak price location below the major poc at 82.73. Bulls would want to see price recover that level.
EURUSD: Chart has reached 1.3418 this week, the 1/2R off June 2010 low but has not yet overcome this Resistance.