S&P 500 emini pre-open Tuesday 10th June
posted 08.52 a.m. est
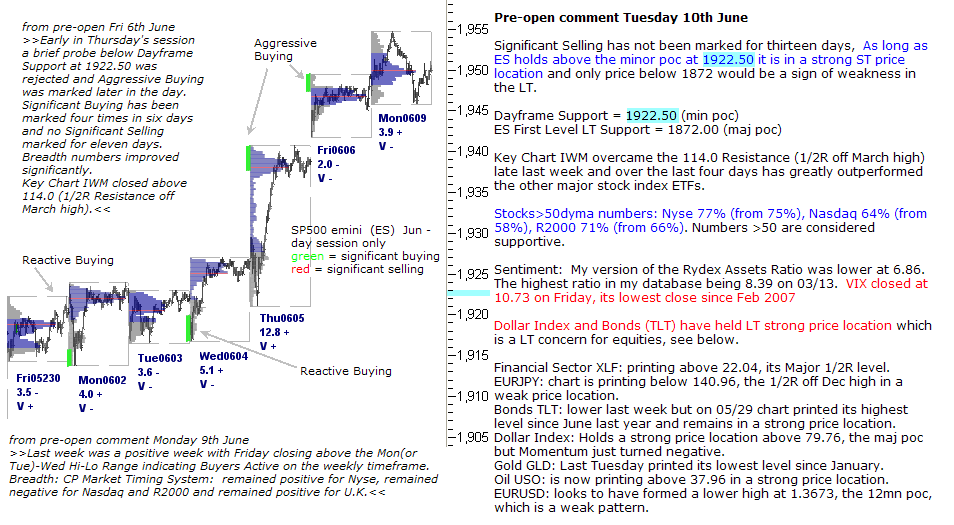
Significant Selling has not been marked for thirteen days, As long as ES holds above the minor poc at 1922.50 it is in a strong ST price location and only price below 1872 would be a sign of weakness in the LT.
Dayframe Support = 1922.50 (min poc)
ES First Level LT Support = 1872.00 (maj poc)
Key Chart IWM overcame the 114.0 Resistance (1/2R off March high) late last week and over the last four days has greatly outperformed the other major stock index ETFs.
Stocks>50dyma numbers: Nyse 77% (from 75%), Nasdaq 64% (from 58%), R2000 71% (from 66%). Numbers >50 are considered supportive.
Sentiment: My version of the Rydex Assets Ratio was lower at 6.86. The highest ratio in my database being 8.39 on 03/13. VIX closed at 10.73 on Friday, its lowest close since Feb 2007
Dollar Index and Bonds (TLT) have held LT strong price location which is a LT concern for equities, see below.
Financial Sector XLF: printing above 22.04, its Major 1/2R level.
EURJPY: chart is printing below 140.96, the 1/2R off Dec high in a weak price location.
Bonds TLT: lower last week but on 05/29 chart printed its highest level since June last year and remains in a strong price location.
Dollar Index: Holds a strong price location above 79.76, the maj poc but Momentum just turned negative.
Gold GLD: Last Tuesday printed its lowest level since January.
Oil USO: is now printing above 37.96 in a strong price location.
EURUSD: looks to have formed a lower high at 1.3673, the 12mn poc, which is a weak pattern.