posted 09.28 a.m. est
Pre-open comment Tuesday 14th January
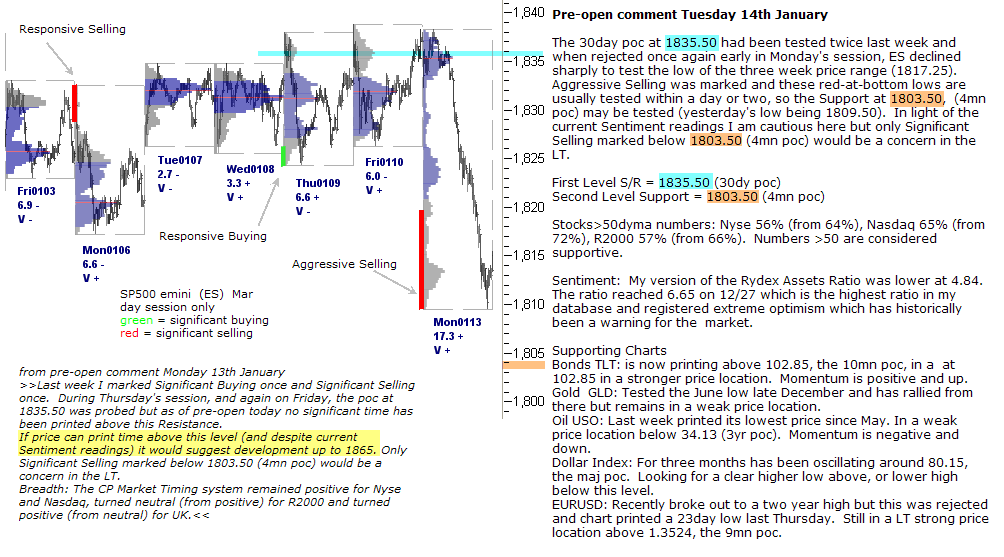
The 30day poc at 1835.50 had been tested twice last week and when rejected once again early in Monday’s session, ES declined sharply to test the low of the three week price range (1817.25). Aggressive Selling was marked and these red-at-bottom lows are usually tested within a day or two, so the Support at 1803.50, (4mn poc) may be tested (yesterday’s low being 1809.50). In light of the current Sentiment readings I am cautious here but only Significant Selling marked below 1803.50 (4mn poc) would be a concern in the LT.
First Level S/R = 1835.50 (30dy poc)
Second Level Support = 1803.50 (4mn poc)
Stocks>50dyma numbers: Nyse 56% (from 64%), Nasdaq 65% (from 72%), R2000 57% (from 66%). Numbers >50 are considered supportive.
Sentiment: My version of the Rydex Assets Ratio was lower at 4.84. The ratio reached 6.65 on 12/27 which is the highest ratio in my database and registered extreme optimism which has historically been a warning for the market.
Supporting Charts
Bonds TLT: is now printing above 102.85, the 10mn poc, in a at 102.85 in a stronger price location. Momentum is positive and up.
Gold GLD: Tested the June low late December and has rallied from there but remains in a weak price location.
Oil USO: Last week printed its lowest price since May. In a weak price location below 34.13 (3yr poc). Momentum is negative and down.
Dollar Index: For three months has been oscillating around 80.15, the maj poc. Looking for a clear higher low above, or lower high below this level.
EURUSD: Recently broke out to a two year high but this was rejected and chart printed a 23day low last Thursday. Still in a LT strong price location above 1.3524, the 9mn poc.