posted 09.12 a.m. est
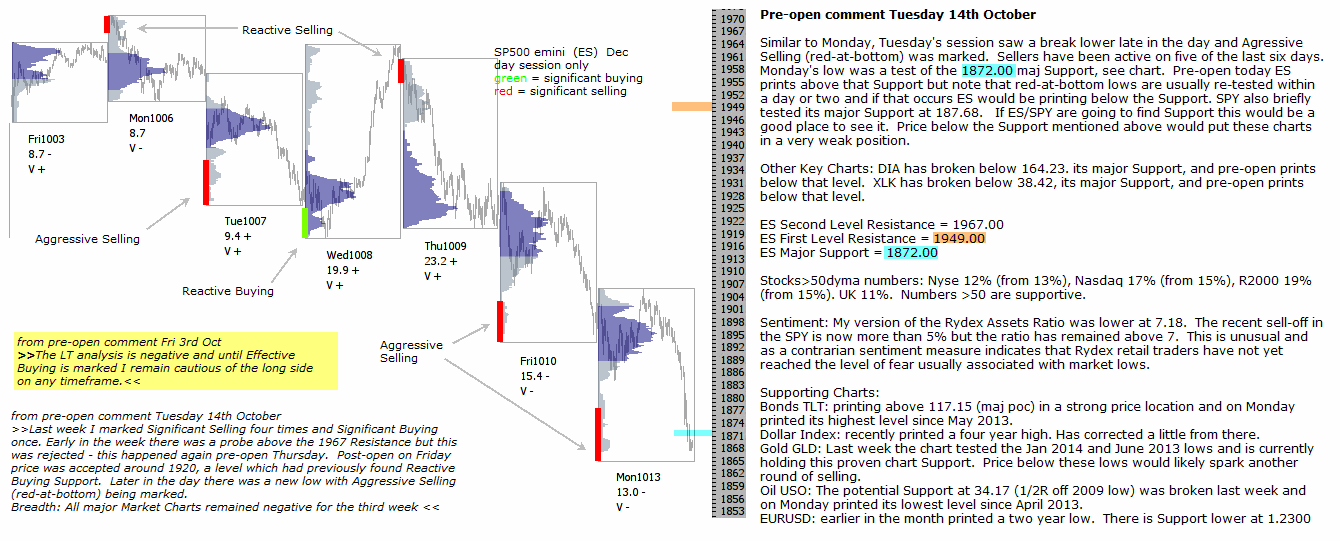
Similar to Monday, Tuesday’s session saw a break lower late in the day and Agressive Selling (red-at-bottom) was marked. Sellers have been active on five of the last six days. Monday’s low was a test of the 1872.00 maj Support, see chart. Pre-open today ES prints above that Support but note that red-at-bottom lows are usually re-tested within a day or two and if that occurs ES would be printing below the Support. SPY also briefly tested its major Support at 187.68. If ES/SPY are going to find Support this would be a good place to see it. Price below the Support mentioned above would put these charts in a very weak position.
Other Key Charts: DIA has broken below 164.23. its major Support, and pre-open prints below that level. XLK has broken below 38.42, its major Support, and pre-open prints below that level.
ES Second Level Resistance = 1967.00
ES First Level Resistance = 1949.00
ES Major Support = 1872.00
Stocks>50dyma numbers: Nyse 12% (from 13%), Nasdaq 17% (from 15%), R2000 19% (from 15%). UK 11%. Numbers >50 are supportive.
Sentiment: My version of the Rydex Assets Ratio was lower at 7.18. The recent sell-off in the SPY is now more than 5% but the ratio has remained above 7. This is unusual and as a contrarian sentiment measure indicates that Rydex retail traders have not yet reached the level of fear usually associated with market lows.
Supporting Charts:
Bonds TLT: printing above 117.15 (maj poc) in a strong price location and on Monday printed its highest level since May 2013.
Dollar Index: recently printed a four year high. Has corrected a little from there.
Gold GLD: Last week the chart tested the Jan 2014 and June 2013 lows and is currently holding this proven chart Support. Price below these lows would likely spark another round of selling.
Oil USO: The potential Support at 34.17 (1/2R off 2009 low) was broken last week and on Monday printed its lowest level since April 2013.
EURUSD: earlier in the month printed a two year low. There is Support lower at 1.2300