posted 08.26 a.m. est
pre-open comment Tuesday 16th July
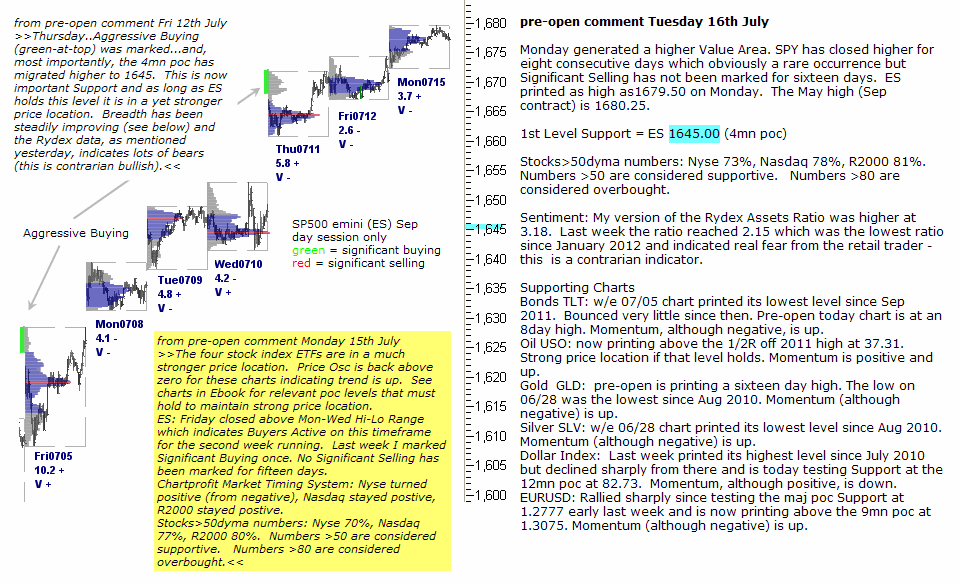
Monday generated a higher Value Area. SPY has closed higher for eight consecutive days which obviously a rare occurrence but Significant Selling has not been marked for sixteen days. ES printed as high as1679.50 on Monday. The May high (Sep contract) is 1680.25.
1st Level Support = ES 1645.00 (4mn poc)
Stocks>50dyma numbers: Nyse 73%, Nasdaq 78%, R2000 81%. Numbers >50 are considered supportive. Numbers >80 are considered overbought.
Sentiment: My version of the Rydex Assets Ratio was higher at 3.18. Last week the ratio reached 2.15 which was the lowest ratio since January 2012 and indicated real fear from the retail trader – this is a contrarian indicator.
Supporting Charts
Bonds TLT: w/e 07/05 chart printed its lowest level since Sep 2011. Bounced very little since then. Pre-open today chart is at an 8day high. Momentum, although negative, is up.
Oil USO: now printing above the 1/2R off 2011 high at 37.31. Strong price location if that level holds. Momentum is positive and up.
Gold GLD: pre-open is printing a sixteen day high. The low on 06/28 was the lowest since Aug 2010. Momentum (although negative) is up.
Silver SLV: w/e 06/28 chart printed its lowest level since Aug 2010. Momentum (although negative) is up.
Dollar Index: Last week printed its highest level since July 2010 but declined sharply from there and is today testing Support at the 12mn poc at 82.73. Momentum, although positive, is down.
EURUSD: Rallied sharply since testing the maj poc Support at 1.2777 early last week and is now printing above the 9mn poc at 1.3075. Momentum (although negative) is up.