S&P 500 emini pre-open Tuesday 17th March
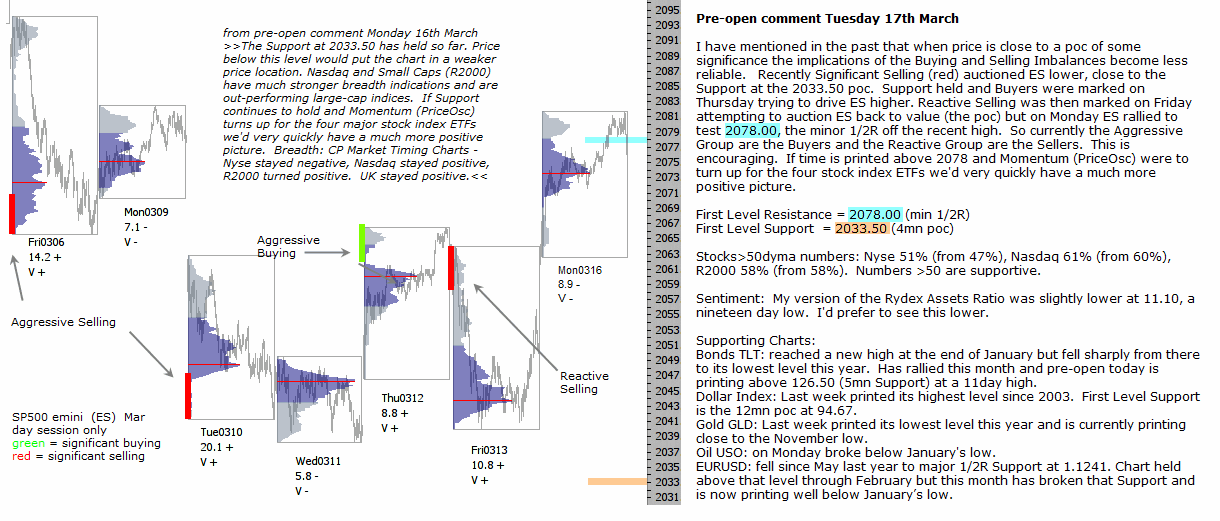
I have mentioned in the past that when price is close to a poc of some significance the implications of the Buying and Selling Imbalances become less reliable. Recently Significant Selling (red) auctioned ES lower, close to the Support at the 2033.50 poc. Support held and Buyers were marked on Thursday trying to drive ES higher. Reactive Selling was then marked on Friday attempting to auction ES back to value (the poc) but on Monday ES rallied to test 2078.00, the minor 1/2R off the recent high. So currently the Aggressive Group are the Buyers and the Reactive Group are the Sellers. This is encouraging. If time is printed above 2078 and Momentum (PriceOsc) were to turn up for the four stock index ETFs we’d very quickly have a much more positive picture.
First Level Resistance = 2078.00 (min 1/2R)
First Level Support = 2033.50 (4mn poc)
Stocks>50dyma numbers: Nyse 51% (from 47%), Nasdaq 61% (from 60%), R2000 58% (from 58%). Numbers >50 are supportive.
Sentiment: My version of the Rydex Assets Ratio was slightly lower at 11.10, a nineteen day low. I’d prefer to see this lower.
Supporting Charts:
Bonds TLT: reached a new high at the end of January but fell sharply from there to its lowest level this year. Has rallied this month and pre-open today is printing above 126.50 (5mn Support) at a 11day high.
Dollar Index: Last week printed its highest level since 2003. First Level Support is the 12mn poc at 94.67.
Gold GLD: Last week printed its lowest level this year and is currently printing close to the November low.
Oil USO: on Monday broke below January’s low.
EURUSD: fell since May last year to major 1/2R Support at 1.1241. Chart held above that level through February but this month has broken that Support and is now printing well below January’s low.