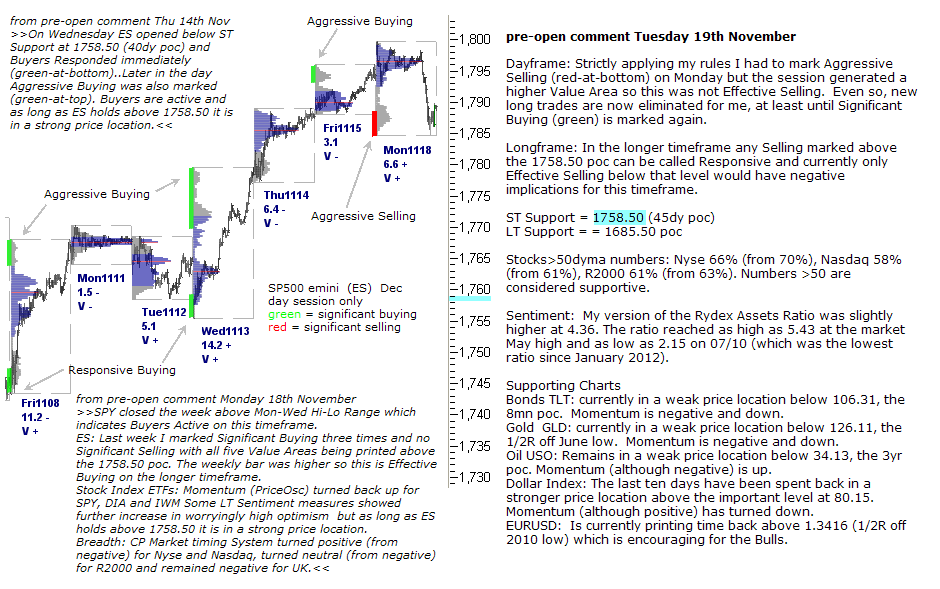
pre-open comment Tuesday 19th November
Dayframe: Strictly applying my rules I had to mark Aggressive Selling (red-at-bottom) on Monday but the session generated a higher Value Area so this was not Effective Selling. Even so, new long trades are now eliminated for me, at least until Significant Buying (green) is marked again.
Longframe: In the longer timeframe any Selling marked above the 1758.50 poc can be called Responsive and currently only Effective Selling below that level would have negative implications for this timeframe.
ST Support = 1758.50 (45dy poc)
LT Support = = 1685.50 poc
Stocks>50dyma numbers: Nyse 66% (from 70%), Nasdaq 58% (from 61%), R2000 61% (from 63%). Numbers >50 are considered supportive.
Sentiment: My version of the Rydex Assets Ratio was slightly higher at 4.36. The ratio reached as high as 5.43 at the market May high and as low as 2.15 on 07/10 (which was the lowest ratio since January 2012).
Supporting Charts
Bonds TLT: currently in a weak price location below 106.31, the 8mn poc. Momentum is negative and down.
Gold GLD: currently in a weak price location below 126.11, the 1/2R off June low. Momentum is negative and down.
Oil USO: Remains in a weak price location below 34.13, the 3yr poc. Momentum (although negative) is up.
Dollar Index: The last ten days have been spent back in a stronger price location above the important level at 80.15. Momentum (although positive) has turned down.
EURUSD: Is currently printing time back above 1.3416 (1/2R off 2010 low) which is encouraging for the Bulls.