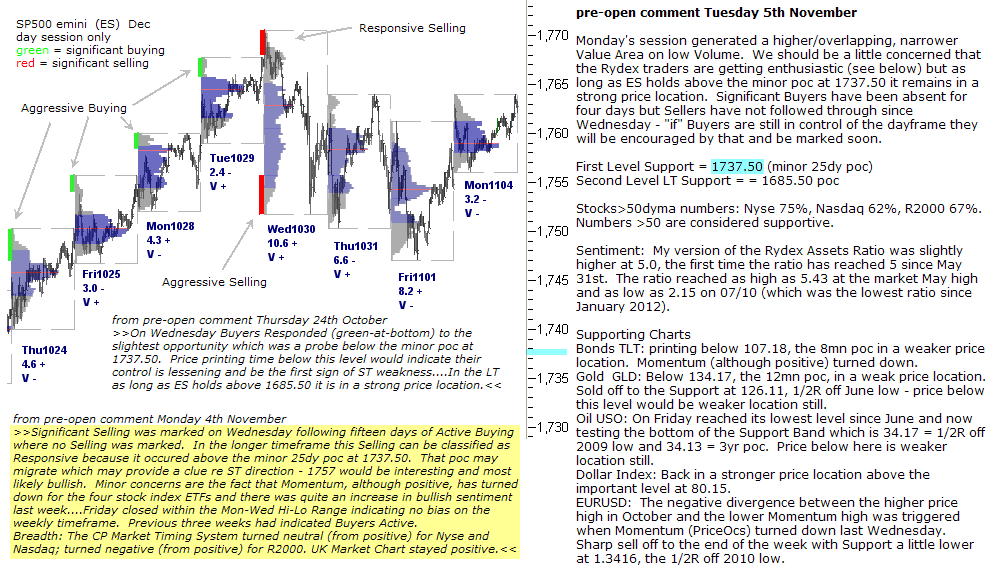
pre-open comment Tuesday 5th November
Monday’s session generated a higher/overlapping, narrower Value Area on low Volume. We should be a little concerned that the Rydex traders are getting enthusiastic (see below) but as long as ES holds above the minor poc at 1737.50 it remains in a strong price location. Significant Buyers have been absent for four days but Sellers have not followed through since Wednesday – “if” Buyers are still in control of the dayframe they will be encouraged by that and be marked soon.
First Level Support = 1737.50 (minor 25dy poc)
Second Level LT Support = = 1685.50 poc
Stocks>50dyma numbers: Nyse 75%, Nasdaq 62%, R2000 67%. Numbers >50 are considered supportive.
Sentiment: My version of the Rydex Assets Ratio was slightly higher at 5.0, the first time the ratio has reached 5 since May 31st. The ratio reached as high as 5.43 at the market May high and as low as 2.15 on 07/10 (which was the lowest ratio since January 2012).
Supporting Charts
Bonds TLT: printing below 107.18, the 8mn poc in a weaker price location. Momentum (although positive) turned down.
Gold GLD: Below 134.17, the 12mn poc, in a weak price location. Sold off to the Support at 126.11, 1/2R off June low – price below this level would be weaker location still.
Oil USO: On Friday reached its lowest level since June and now testing the bottom of the Support Band which is 34.17 = 1/2R off 2009 low and 34.13 = 3yr poc. Price below here is weaker location still.
Dollar Index: Back in a stronger price location above the important level at 80.15.
EURUSD: The negative divergence between the higher price high in October and the lower Momentum high was triggered when Momentum (PriceOcs) turned down last Wednesday. Sharp sell off to the end of the week with Support a little lower at 1.3416, the 1/2R off 2010 low.