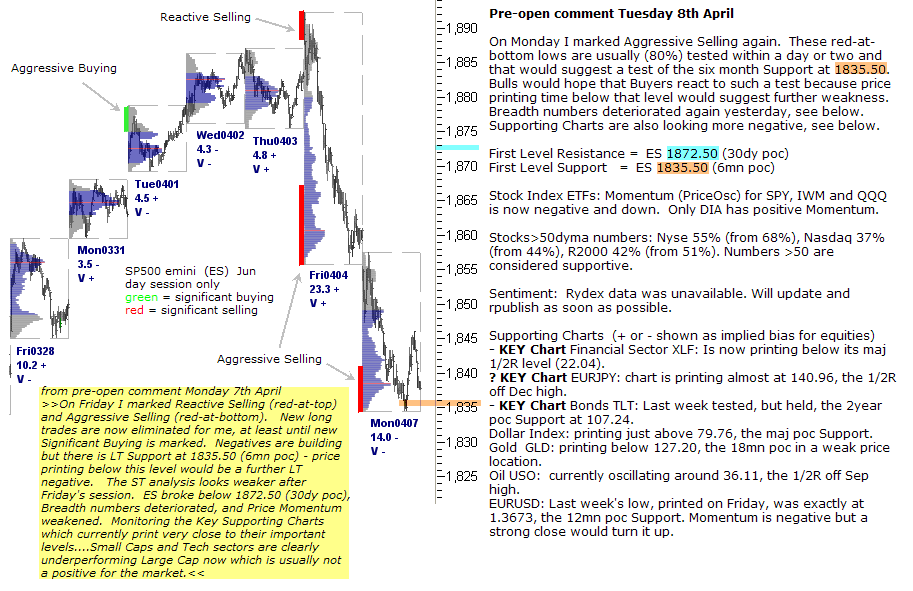
Pre-open comment Tuesday 8th April
On Monday I marked Aggressive Selling again. These red-at-bottom lows are usually (80%) tested within a day or two and that would suggest a test of the six month Support at 1835.50. Bulls would hope that Buyers react to such a test because price printing time below that level would suggest further weakness. Breadth numbers deteriorated again yesterday, see below. Supporting Charts are also looking more negative, see below.
First Level Resistance = ES 1872.50 (30dy poc)
First Level Support = ES 1835.50 (6mn poc)
Stock Index ETFs: Momentum (PriceOsc) for SPY, IWM and QQQ is now negative and down. Only DIA has positive Momentum.
Stocks>50dyma numbers: Nyse 55% (from 68%), Nasdaq 37% (from 44%), R2000 42% (from 51%). Numbers >50 are considered supportive.
Sentiment: Rydex data was unavailable. Will update and rpublish as soon as possible.
Supporting Charts (+ or – shown as implied bias for equities)
– KEY Chart Financial Sector XLF: Is now printing below its maj 1/2R level (22.04).
? KEY Chart EURJPY: chart is printing almost at 140.96, the 1/2R off Dec high.
– KEY Chart Bonds TLT: Last week tested, but held, the 2year poc Support at 107.24.
Dollar Index: printing just above 79.76, the maj poc Support.
Gold GLD: printing below 127.20, the 18mn poc in a weak price location.
Oil USO: currently oscillating around 36.11, the 1/2R off Sep high.
EURUSD: Last week’s low, printed on Friday, was exactly at 1.3673, the 12mn poc Support. Momentum is negative but a strong close would turn it up.