posted 03.50 a.m. est
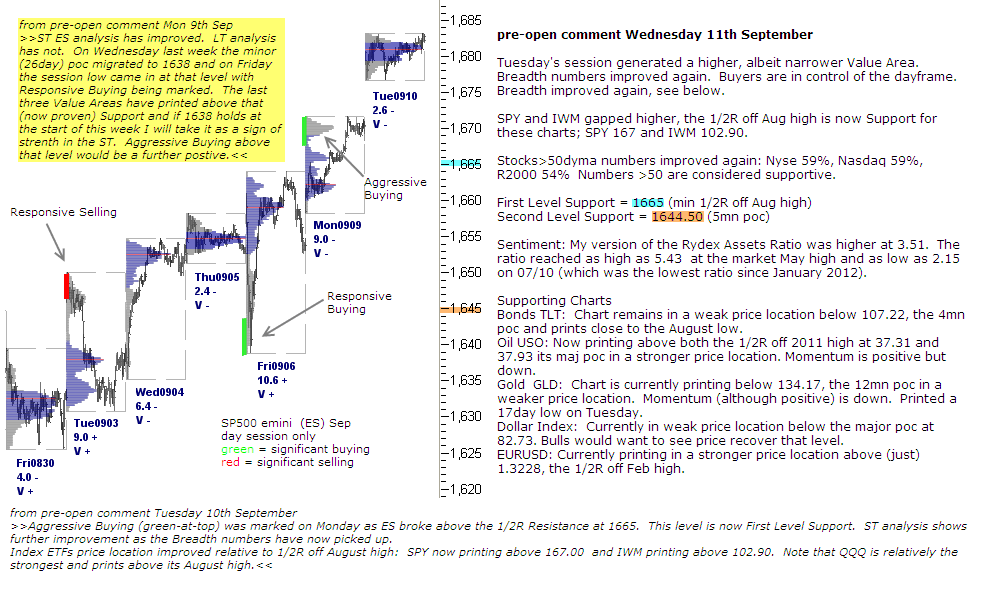
pre-open comment Wednesday 11th September
Tuesday’s session generated a higher, albeit narrower Value Area. Breadth numbers improved again. Buyers are in control of the dayframe. Breadth improved again, see below.
SPY and IWM gapped higher, the 1/2R off Aug high is now Support for these charts; SPY 167 and IWM 102.90.
Stocks>50dyma numbers improved again: Nyse 59%, Nasdaq 59%, R2000 54% Numbers >50 are considered supportive.
First Level Support = 1665 (min 1/2R off Aug high)
Second Level Support = 1644.50 (5mn poc)
Sentiment: My version of the Rydex Assets Ratio was higher at 3.51. The ratio reached as high as 5.43 at the market May high and as low as 2.15 on 07/10 (which was the lowest ratio since January 2012).
Supporting Charts
Bonds TLT: Chart remains in a weak price location below 107.22, the 4mn poc and prints close to the August low.
Oil USO: Now printing above both the 1/2R off 2011 high at 37.31 and 37.93 its maj poc in a stronger price location. Momentum is positive but down.
Gold GLD: Chart is currently printing below 134.17, the 12mn poc in a weaker price location. Momentum (although positive) is down. Printed a 17day low on Tuesday.
Dollar Index: Currently in weak price location below the major poc at 82.73. Bulls would want to see price recover that level.
EURUSD: Currently printing in a stronger price location above (just) 1.3228, the 1/2R off Feb high.