posted 08.45 a.m. est
Pre-open comment Wednesday 23rd April
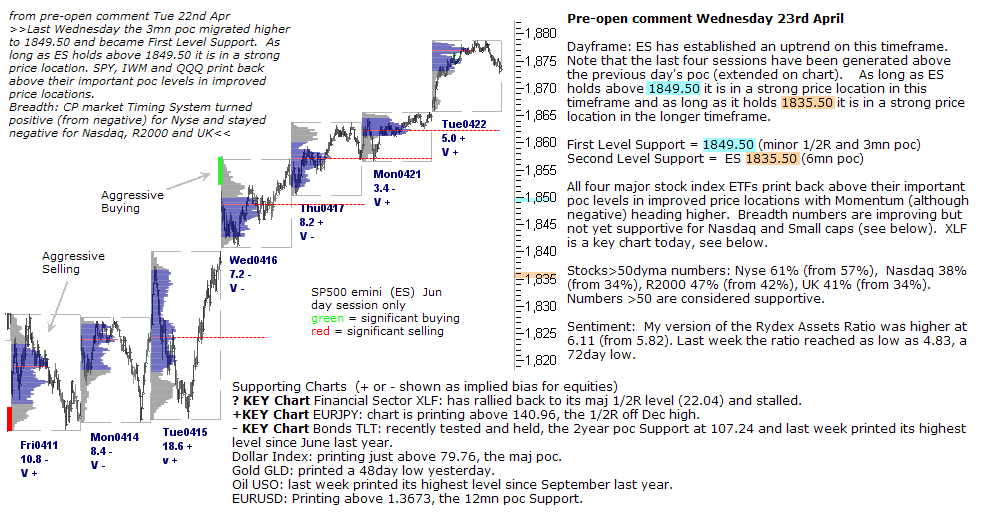
Dayframe: ES has established an uptrend on this timeframe. Note that the last four sessions have been generated above the previous day’s poc (extended on chart). As long as ES holds above 1849.50 it is in a strong price location in this timeframe and as long as it holds 1835.50 it is in a strong price location in the longer timeframe.
First Level Support = 1849.50 (minor 1/2R and 3mn poc)
Second Level Support = ES 1835.50 (6mn poc)
All four major stock index ETFs print back above their important poc levels in improved price locations with Momentum (although negative) heading higher. Breadth numbers are improving but not yet supportive for Nasdaq and Small caps (see below). XLF is a key chart today, see below.
Stocks>50dyma numbers: Nyse 61% (from 57%), Nasdaq 38% (from 34%), R2000 47% (from 42%), UK 41% (from 34%). Numbers >50 are considered supportive.
Sentiment: My version of the Rydex Assets Ratio was higher at 6.11 (from 5.82). Last week the ratio reached as low as 4.83, a 72day low.
Supporting Charts (+ or – shown as implied bias for equities)
? KEY Chart Financial Sector XLF: has rallied back to its maj 1/2R level (22.04) and stalled.
+KEY Chart EURJPY: chart is printing above 140.96, the 1/2R off Dec high.
– KEY Chart Bonds TLT: recently tested and held, the 2year poc Support at 107.24 and last week printed its highest level since June last year.
Dollar Index: printing just above 79.76, the maj poc.
Gold GLD: printed a 48day low yesterday.
Oil USO: last week printed its highest level since September last year.
EURUSD: Printing above 1.3673, the 12mn poc Support.